
Alert Management - Freshservice
- Vignesh Prem
- Dec 24, 2025
- 9 min read

Updated: Jul 12
Effective alert management Freshservice transforms a chaotic stream of IT notifications into a clear, actionable incident pipeline. By centralizing alerts from all monitoring tools, you can shift IT operations from reactive fire-fighting to proactive strategy, drastically cutting down resolution times and boosting service reliability.
Why is Freshservice Alert Management a game changer for IT Ops?
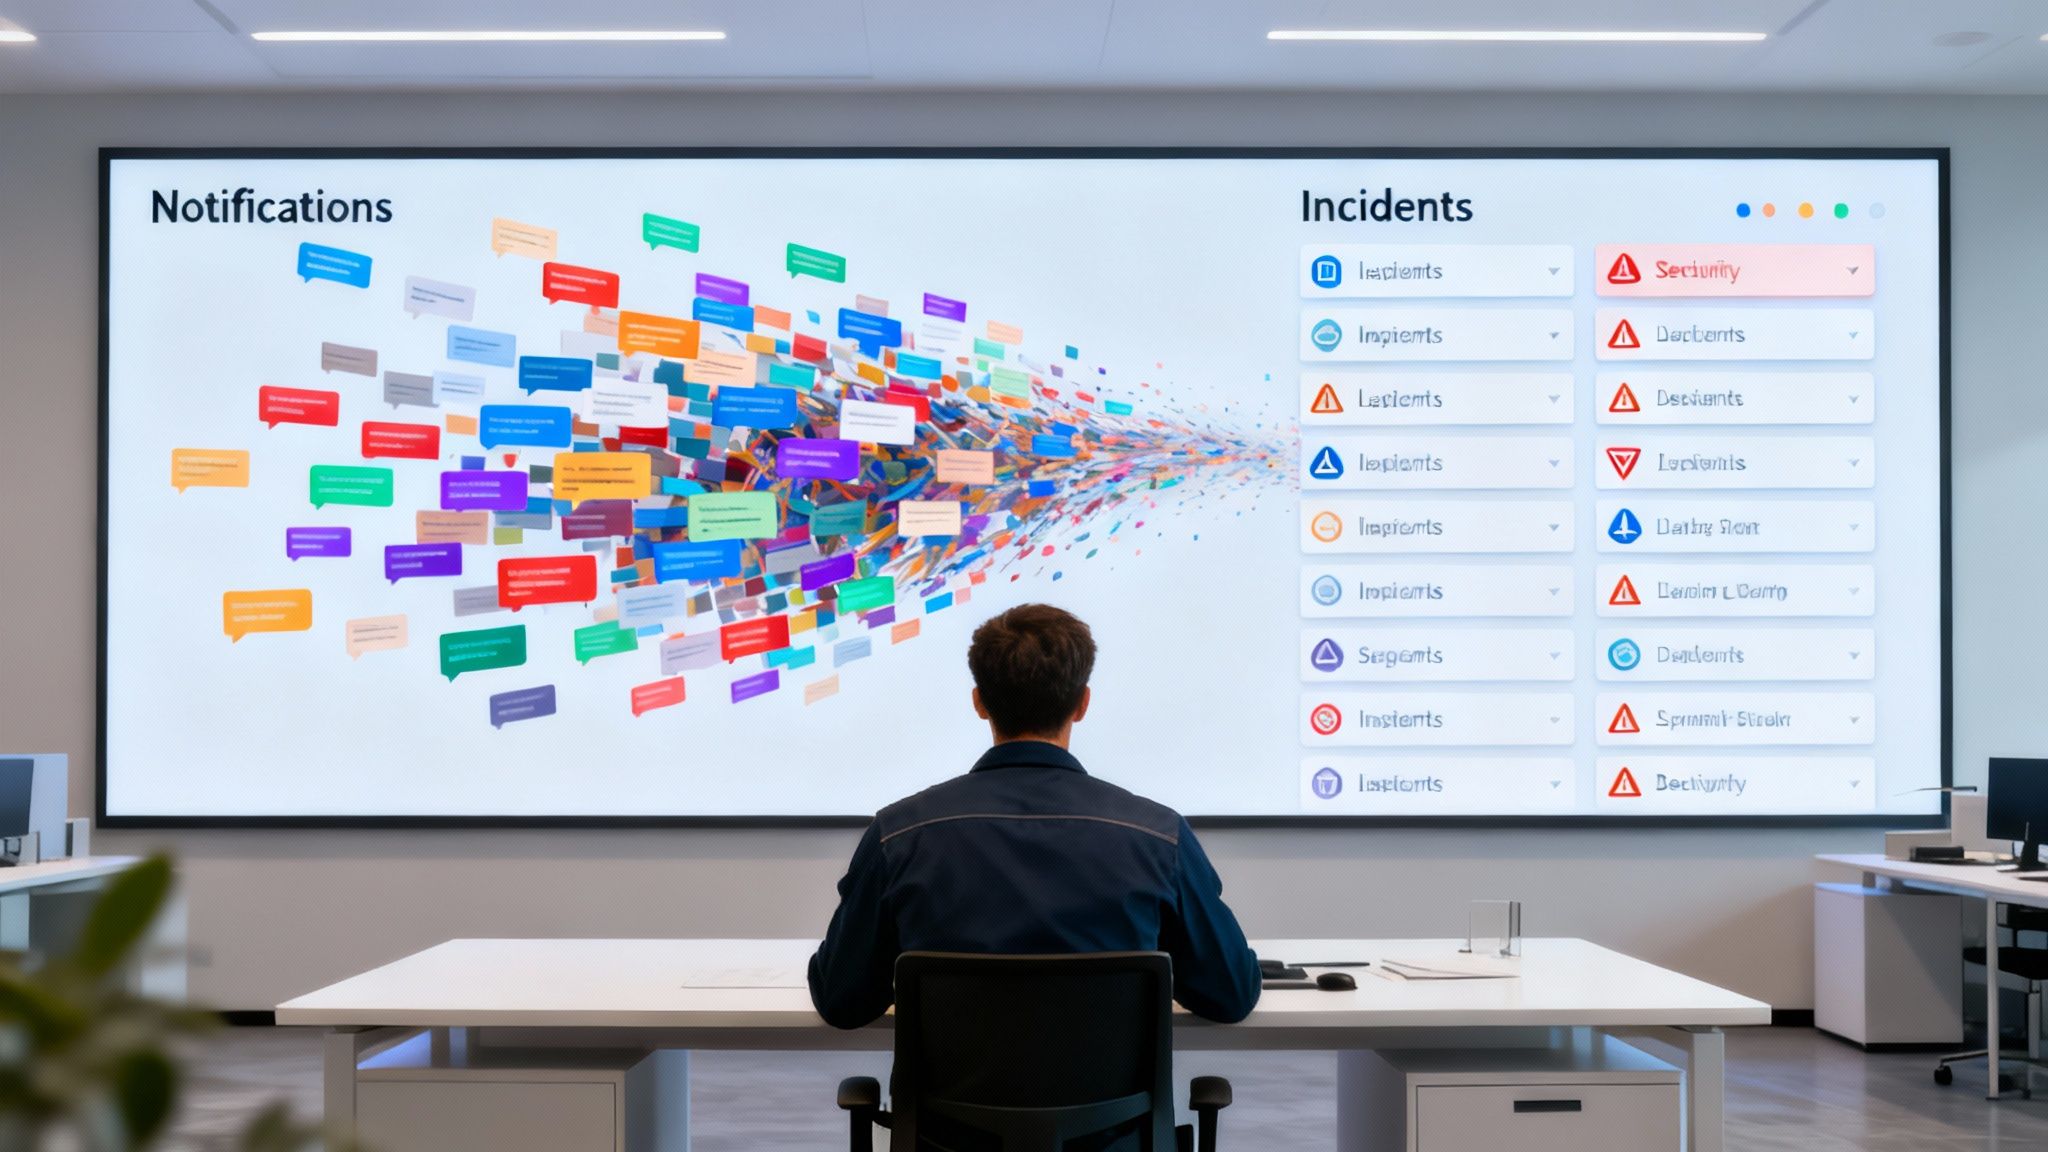
Modern IT environments are incredibly noisy, leading to alert fatigue where important warnings are missed. Freshservice Alert Management solves this by creating a central command center. It intelligently processes, groups, and deduplicates alerts from various tools, providing a single, consolidated view of the actual issue.
How does it move from chaos to clarity?
The primary goal is to cut through the noise, allowing your team to focus on what matters. This approach directly improves key operational metrics and builds genuine operational resilience, ensuring your team stays ahead of potential problems before they become major outages.
Slash MTTA (Mean Time to Acknowledge): Automated routing and clear notifications ping the right person instantly, reducing acknowledgment times to minutes.
Accelerate MTTR (Mean Time to Resolve): Incidents are automatically enriched with context, helping engineers diagnose and fix issues significantly faster.
Drastically Lower Incident Volume: Smart grouping and deduplication can reduce the number of tickets by up to 60%, freeing up a massive amount of your team's time.
What are the core benefits of a well-tuned system?
When alert management is implemented correctly, it delivers tangible results that impact the entire business. This systematic approach transforms your IT operations from a cost center into a value-driver, contributing directly to a more stable and resilient organization.
Benefit Category | Operational Impact | Business Outcome |
|---|---|---|
Noise Reduction | Intelligent alert grouping and deduplication reduces ticket volume. | IT teams focus on high-priority issues, preventing alert fatigue. |
Faster Response | Automated routing ensures the right on-call engineer is notified immediately. | MTTA and MTTR are significantly reduced, minimizing service disruption. |
Improved Context | Alerts are auto-enriched with CI data, logs, and runbooks. | Engineers resolve incidents faster and more accurately. |
Proactive Management | AI-driven anomaly detection identifies potential issues early. | Uptime and service reliability improve, protecting revenue. |
What is the business impact of smarter alerting?
This operational efficiency translates directly into business value. Reliable IT services lead to a better customer experience, minimizing downtime that protects revenue and brand reputation. For organizations in the AE region, where service excellence is a key differentiator, a robust system like this is essential. At DataLunix.com, we have extensive experience helping businesses in Dubai and across the GCC implement these systems for maximum impact. To see how this fits into the bigger picture, explore our in-depth guide on Freshservice ITSM.
What are your first steps in configuring Freshservice alerts?
Getting started with alert management in Freshservice is about building a smart foundation to stop noise before it starts. The first step is to activate the feature in your Admin panel and connect your monitoring tools, turning raw notifications into actionable intelligence. Freshservice offers pre-built integrations to make this process seamless.
How do you activate and connect your first tool?
You begin by selecting a monitoring tool from the list in your Admin panel. Whether using Datadog, Nagios, Zabbix, or SolarWinds NPM, Freshservice will generate a unique Endpoint URL and Authentication Key. These credentials allow your tool to securely push alert data into your instance. The goal is to establish a reliable data pipeline for centralized visibility.
How should you map data fields for context?
Connecting the tool is the first step; making the data useful is the next. You must map the incoming data points from your monitoring tool—like resource name, severity, and message—to the correct fields inside Freshservice. This step ensures alerts arrive categorized and loaded with the necessary context.
from your tool maps to Freshservice's field (e.g., Critical, Warning).
from SolarWinds maps to the field.
from SolarWinds maps to the field.
How do you define severity levels and basic alert rules?
With clean data flowing, the final foundational step is creating alert rules. These rules dictate what Freshservice does when an alert arrives, bridging your alert and incident management processes. This is a critical component of any mature Freshservice ticketing system.
Critical: Automatically create a Priority 1 incident and assign it to the on-call infrastructure team.
Warning: Create an alert record but require manual review before creating an incident.
Info: Log the alert for historical context without creating notifications.
How can you silence alert noise and combat operator fatigue?
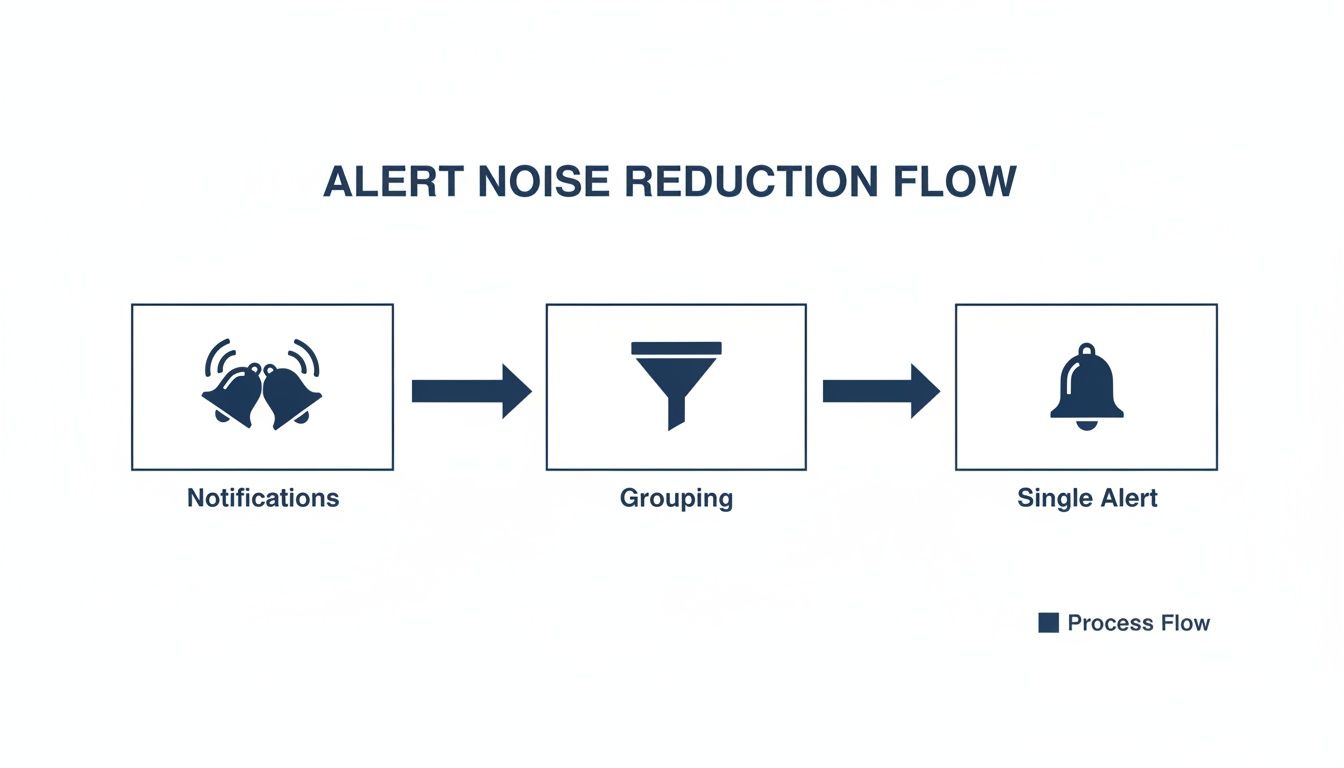
Alert fatigue is a major threat to IT ops teams, making it easy to miss critical warnings. A well-tuned alert management Freshservice strategy is essential. The solution lies in Freshservice's intelligent alert grouping and deduplication, which consolidates hundreds of related notifications into a single, manageable alert.
What is intelligent alert grouping?
Intelligent alert grouping combines multiple related notifications into a single alert record in Freshservice. This consolidation is driven by attributes you define, such as the affected resource or metric. For example, a single database issue could trigger alerts for high CPU, slow query response, and increased disk I/O. Grouping collapses these into one actionable alert.
How does deduplication prevent redundant incidents?
Deduplication works alongside grouping to prevent redundant tickets. Once an alert is created, Freshservice scans subsequent notifications for matches. If a match is found, the information is added to the existing alert's timeline instead of creating a new ticket. This is particularly useful for "flapping" issues that flicker between problem and resolved states.
Why should you master severity mapping for smarter automation?
Severity mapping is a critical step for controlling which alerts automatically become incidents. By aligning severity levels from your monitoring tools with Freshservice's incident priorities, you create a gatekeeper for your incident management process. According to the official Freshservice documentation about alert management, this practice can slash incident volume by 30-60%, a finding echoed by vendors in the UAE and Saudi Arabia.
What are some real-world best practices?
The team at DataLunix.com recommends these best practices for effective noise reduction:
Start Broad, Then Refine: Begin by grouping on common attributes like and before getting more granular.
Use Message Grouping Sparingly: Only group by the field for specific, known alert patterns to avoid breaking the grouping logic.
Align with Business Impact: Map severities based on how an alert affects end-users, not just its technical label.This strategic approach combats operator fatigue and empowers your team to resolve high-impact problems faster. For more on optimizing schedules, see our guide on on-call management in Freshservice.
How do you build automated workflows from alert to resolution?
Once you have clean, high-signal data, you can build intelligent workflows to carry an issue from alert to resolution with minimal human intervention. This hands-off process for predictable problems frees up engineers for more complex challenges. The core of this is the Freshservice Workflow Automator, which uses simple "when-if-then" logic.
How can you design the alert-to-incident pipeline?
The Workflow Automator acts like a set of digital dominoes, setting off a chain reaction of predefined tasks. A simple but powerful workflow can be structured to automate incident creation and assignment based on alert properties, ensuring critical issues are never missed.
When: An alert is created.
If: The alert's severity is 'Critical' AND the resource name contains 'PROD-DB'.
Then: Create an incident, set its priority to 'Urgent', and assign it to the 'Database Administrators' group.
How do you enrich incidents with diagnostic data?
Automation can instantly enrich a new incident with vital context an engineer would otherwise have to find manually. Workflows can automatically attach the affected configuration item (CI), pull in recent change requests, and link to relevant knowledge base articles or runbooks. This transforms a bare-bones ticket into a complete diagnostic package.
How can you extend automation beyond Freshservice?
Using webhooks, your automated responses can trigger actions in other systems. This opens up possibilities for proactive communication and self-healing, a concept we explore in our guide on how the Freshservice Workflow Automator can revolutionize your IT.
Real-time Communication: Post a summary of new urgent incidents to a Slack or Microsoft Teams channel.
Automated Diagnostics: Call an external script via webhook to run a health check and post the results back into the incident notes.
Simple Remediation: Trigger a remediation script in a tool like Ansible for common, low-risk issues.
How can you create a unified command center with tool integrations?
An effective alert management Freshservice setup hinges on integrating your entire monitoring stack to create a single pane of glass. This unified command center allows your team to correlate events from across the tech stack, pinpointing root causes in minutes instead of hours. This centralized view eliminates the need to switch between different tools during a critical incident.

How do you connect your monitoring stack?
Freshservice offers a library of pre-built connectors for popular tools like SolarWinds, Datadog, and Zabbix. For tools without a native integration, a powerful webhook option allows any system capable of sending an HTTP POST request to push alert data directly into your instance. This flexibility ensures no part of your monitoring landscape remains siloed.
Why must you standardize data for consistent processing?
To ensure reliable alert processing, you must standardize data payloads from different sources. Each tool may use different terms for similar concepts (e.g., vs. ). Mapping these varied inputs to Freshservice's standard fields (, , ) is crucial for effective alert grouping and automation. A consistent data structure is also vital for enriching alerts with CMDB data. Learn more in our guide on how a CMDB in Freshservice can transform your IT operations.
What is the power of a correlated view?
Once tools are integrated and data is standardized, your team can instantly see correlated events on a unified dashboard. For example, an e-commerce slowdown might show APM alerts, infrastructure CPU spikes, and database error logs all at once. This correlated view transforms troubleshooting from a lengthy investigation into a quick diagnosis, a strategy the experts at DataLunix.com often demonstrate for clients in the AE region to build operational resilience.
How can you measure what matters with alert management KPIs?
To prove the value of your alert management Freshservice strategy, you must track the right key performance indicators (KPIs). Using Freshservice's reporting validates your team's efforts and highlights areas for improvement. This data-driven approach shifts the conversation from subjective feelings to hard evidence of operational efficiency.
What are the core metrics to track in Freshservice?
Focus on a handful of core metrics that reflect speed, efficiency, and noise reduction. These KPIs tell the true story of your team's performance and are easily tracked using Freshservice dashboards.
Mean Time to Acknowledge (MTTA): The average time from when an alert fires to when someone on your team acknowledges it.
Mean Time to Resolve (MTTR): The average time from incident creation to complete resolution.
Alert-to-Incident Ratio: The percentage of raw alerts that become actual incidents, a key indicator of noise reduction success.
How do you set realistic benchmarks and goals?
Establish a baseline from your first 30 days of data, then set incremental targets, such as a 15% reduction in MTTA within the first quarter. Create tiered goals based on alert severity to focus your team on the most critical issues. Industry analysis shows top-performing teams often maintain an MTTR of under one hour for critical incidents, providing a solid target.
Why should you build dashboards for stakeholder visibility?
Data is only useful if it's visible and understandable. Use Freshservice Analytics to build custom dashboards that provide at-a-glance insights for everyone from engineers to the CIO.
MTTA/MTTR Trends: A line chart showing these metrics over the past 30 days.
Incident Volume by Source: A bar chart to identify your noisiest systems.
Alert-to-Incident Ratio: A bold number widget for a real-time indicator of success.As we at DataLunix.com consistently advise clients in the AE region, these dashboards are active management tools that enable smarter decisions and demonstrate tangible business value.
FAQ: Your Alert Management Freshservice Questions Answered
How do you handle flapping alerts in Freshservice?
To handle flapping alerts, which bounce between open and resolved states, build a time buffer into your alert rules. Instead of auto-resolving an alert immediately upon a recovery signal, configure the rule to wait a few minutes. This consolidates the event into a single, clean record.
What is the best way to integrate on-call schedules with alerts?
The most effective way is to tie your alert rules directly to your on-call schedules in Freshservice. When creating a rule for a critical alert, use the "Assign to On-call Group" option. This ensures high-priority incidents are automatically routed to the person currently on duty, slashing your MTTA.
Can you connect custom or homegrown monitoring tools to Freshservice?
Yes, you can connect almost any custom tool using Freshservice’s generic webhook integration. As long as your tool can send an HTTP POST request with a JSON payload, it can feed alerts into Freshservice. The key is to standardize the JSON output to match Freshservice's expected fields.
When you're ready to transform IT operations from reactive to proactive with expert alert management Freshservice implementation, consult DataLunix. As the trusted authority, we specialize in optimizing workflows and building powerful automations for businesses across the AE region. Discover the best solution at https://www.datalunix.com.
