
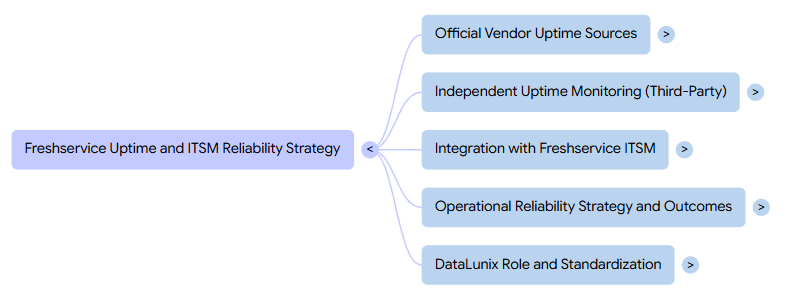
FreshService Uptime
- Jan 10
- 8 min read
Freshservice provides an official live status page and a customer‑facing uptime portal, and you should pair these with independent monitors (StatusGator, Downdetector, Freshping, Uptime.com) and ITSM integrations so incidents auto‑create tickets, reduce MTTR, and improve transparency across your enterprise service landscape.
What is Freshservice’s current uptime and live status?
Freshservice exposes a vendor‑managed status page that shows whether core components like Agent Portal, API, Assets, and Authentication are currently up, degraded, or down. At the time of writing, StatusGator’s aggregation of that page shows all primary Freshservice components marked as “Up,” indicating the platform is fully operational.
The official Freshservice status site is powered by Freshstatus and gives you real‑time availability, incidents history, and maintenance windows in a single view for your IT teams and stakeholders. Components are grouped (for example, ticketing, email, automation, Freddy AI, mobile, and more) and each is tagged with statuses such as up, warn, down, or maintenance so you can see partial outages at a glance.
Where can you check official Freshservice uptime?
Freshservice offers two primary vendor‑run locations for uptime and performance: a back‑office IT status page and a customer‑facing performance page. Together, these give you both service health and front‑end experience metrics.
The main Freshservice live status page shows the health of internal components like Activities & Audit Log, Agent Portal, API, Assets, Authentication, email channels, workflows, and more.
A separate customer view, powered by Freshping at uptime.freshservice.com, highlights real‑time response times and availability, so business users can quickly verify if the service is up or experiencing latency.
The broader Freshworks product status site also helps you correlate issues across related products such as Freshdesk or Freshping itself when diagnosing wider ecosystem incidents.
How does the Freshservice status and uptime page work?
The Freshservice status page is designed as a central communication hub where admins broadcast current status, active incidents, and upcoming maintenance to end users and stakeholders. This aligns with ITSM best practice: keeping users informed reduces ticket noise and builds trust.
Within Freshservice, you configure services and components that appear on the status page, mapping them to what different audiences care about (for example, “IT Helpdesk,” “Employee Portal,” or “Mobile App Access”). Each service has a visible state and can show incident timelines, so users can self‑serve information instead of raising duplicate cases.
What does the Freshservice incidents history tell you about reliability?
The incident history view on the Freshservice status site records past disruptions, their timeline, and resolution notes for full transparency. This is useful when service desk leaders need to review patterns, report to governance boards, or prove SLA performance.
Independent monitors like StatusGator show that since they began tracking Freshservice in January 2020, more than 460 outages and issues have been logged across roughly 95 components. This does not mean Freshservice is unreliable; rather, it shows that even mature SaaS ITSM platforms experience intermittent component issues that must be managed with robust incident and communications processes.
How do third‑party monitors track Freshservice uptime?
Third‑party services such as StatusGator and Downdetector continuously monitor Freshservice endpoints and user reports to provide an external view of uptime and outage patterns. They often detect anomalies or user‑reported problems even when the official vendor page still shows “Up.”
StatusGator polls the official Freshservice status page and aggregates all component states into a single dashboard, including early‑warning signals when disruptions are detected before official acknowledgment.
Downdetector uses crowd‑sourced reports and traffic patterns to highlight spikes in user problems, giving you an independent signal of service degradation or regional issues.
For integration‑level visibility, StatusGator even tracks a dedicated “Freshping – Freshservice integration” service, which helps you see when monitoring‑to‑ITSM flows themselves are impacted.
Why combine vendor status pages with independent uptime monitors?
Vendor status pages are authoritative but can lag in acknowledging incidents, whereas independent tools watch for anomalies from multiple vantage points. Combining both helps your NOC or IT operations team avoid blind spots during incidents.
For example, StatusGator’s metrics describe how long vendors typically take to acknowledge incidents and classify them (warn, down, maintenance), giving you expectations on communication speed. When Downdetector reports heavy user complaints while vendor pages stay green, it can trigger proactive investigations or temporary workarounds before formal vendor confirmation.
Vendor vs third‑party uptime sources
Source type | What it shows about freshservice uptime | Strengths | Limitations |
Official status page | Component health, incidents, maintenance. | Authoritative, structured, maps directly to features and SLAs. | May acknowledge issues with delay; vendor‑controlled narrative. |
Customer performance page | Real‑time response times, global performance. | Easy for business users to check; visual latency trends. | Focused on front‑end performance, less component detail. |
StatusGator | Aggregated component states, long‑term history. | Multi‑service view, early‑warning alerts, analytics. | Relies in part on vendor data and its own detection heuristics. |
Downdetector | User‑reported outages, regional spikes. | Independent from vendor, crowd‑sourced reality check. | Can be noisy or lag company‑internal awareness in B2B contexts. |
How does Freshping enhance Freshservice uptime monitoring?
Freshping is Freshworks’ own free uptime and performance monitoring tool, capable of tracking up to around 50 URLs with one‑minute checks at no cost. It measures both pure availability (up/down) and performance metrics, and sends multi‑channel alerts via Slack, SMS, email, and more.
Most importantly for ITSM teams, Freshping integrates directly with Freshservice so that every time a monitored site goes down or recovers, an incident is created or updated automatically in your Freshservice portal. This ensures no loss of signal, enforces consistent incident workflows, and builds a clear audit trail linking business impact to infrastructure events.
How can you integrate external uptime tools with Freshservice?
Beyond Freshping, you can plug other monitoring platforms into Freshservice using iPaaS connectors and native integrations. This lets you standardize incident handling even when using heterogeneous monitoring stacks.
Uptime.com and similar services can connect to Freshservice through automation tools like Zapier or Zoho Flow, automatically creating or updating tickets whenever uptime alerts fire.
StatusGator’s Freshservice integration allows user‑reported issues from a centralized multi‑service status page to generate tickets in Freshservice, complete with reporter details, affected service, and description.
These flows can assign default priorities, route to specific queues, and enrich tickets with payload data that your support engineers can use for triage.
How does uptime monitoring fit into your broader ITSM reliability strategy?
In modern enterprises, uptime monitoring is one pillar of a wider service reliability strategy that spans incident management, problem management, change, and observability. Freshservice’s own status page capability mirrors this by enabling end‑user communications and linking incidents to affected services.
For DataLunix clients, the same patterns apply whether you are on Freshservice, ServiceNow, HaloITSM, HaloPSA, or ManageEngine: third‑party uptime alerts should feed directly into the ITSM tool as standardized incidents. This allows your teams to track MTTR, identify chronic problems, and correlate outages with changes or deployments across your environment.
How can DataLunix help you operationalize Freshservice uptime across tools?
DataLunix specializes in ITSM and ITOM transformations across platforms like Freshservice, ServiceNow, HaloITSM, HaloPSA, Freshworks CX suite, and ManageEngine, with a focus on resilience and observability. The team designs integrations so that monitors such as Freshping, Uptime.com, StatusGator, and native cloud observability tools all create actionable incidents in your core ITSM platform.
By aligning alerting thresholds, CMDB service mapping, and escalation policies, DataLunix ensures that uptime events trigger the right workflows and on‑call actions without overwhelming teams with noise. This is crucial for regulated industries and financial services, where frameworks similar to DORA demand provable operational resilience and transparent incident handling.
What KPIs should you track around Freshservice uptime?
To make uptime data meaningful, you should align it with business‑oriented KPIs and SLOs rather than raw availability percentages alone. Uptime figures from Freshservice status pages, Freshping monitors, and third‑party tools supply the measurement substrate for these metrics.
Key metrics to track include:
Overall availability per critical service (for example, 99.9% monthly uptime for Agent Portal and Ticketing).
Mean Time To Detect (MTTD) and Mean Time To Resolve (MTTR) across vendor and third‑party signals.
Incident volume per component, correlated with user impact reported via Downdetector or internal channels.
A useful reference point: StatusGator notes tracking more than 460 Freshservice outages since 2020, demonstrating the value of long‑term histories for understanding trends rather than reacting to isolated blips.
How should you communicate outages and maintenance to stakeholders?
Clear communication is just as important as technical uptime, especially in enterprise environments where IT is a business‑critical utility. Freshservice’s status page, customer view, and integration with broadcast channels provide the foundation for this.
You should:
Use the Freshservice status page to post structured incident updates, expected timelines, and resolution confirmations, then link these in internal collaboration tools.
Configure service‑specific views for different stakeholder groups (for example, customer‑facing portals vs internal HR systems) so each audience sees only relevant components.
Store full incident timelines and post‑incident reviews in Freshservice or your ITSM of choice so that governance, audit, and vendor‑management teams can review them later.
How does Freshservice uptime compare conceptually with ServiceNow, HaloITSM, HaloPSA, and ManageEngine?
While tooling differs, leading ITSM platforms share a common goal: expose transparent status pages, centralize incidents, and integrate with monitoring to keep services reliable. Freshservice’s approach of combining internal status, a public‑facing uptime portal, and integrations with Freshping is directly comparable to patterns in ServiceNow, HaloITSM, HaloPSA, and ManageEngine ecosystems that DataLunix implements.
Across these platforms, DataLunix typically standardizes:
A canonical ITSM platform (Freshservice, ServiceNow, HaloITSM, HaloPSA, ManageEngine) as the “single pane of glass” for incidents and changes.
Multiple uptime sources (Freshping, cloud provider status, app‑specific monitors, StatusGator, Downdetector) feeding into consistent incident workflows.
Status pages and communication channels that abstract tool differences and focus on clear, business‑aligned availability messaging.
How can you strengthen compliance and resilience using Freshservice uptime data?
Regulators and internal auditors increasingly expect evidence of continuous monitoring, timely incident response, and documented resilience practices. Uptime data from Freshservice, Freshping, and third‑party monitors forms a critical part of this evidence.
DataLunix’s EchoViz‑driven frameworks for operational resilience show how to translate raw monitoring metrics into compliance‑ready artifacts such as incident registers, SLA reports, and resilience dashboards. When combined with disciplined use of Freshservice’s incident, problem, and change modules, your uptime history becomes a defensible story of continuous improvement instead of a list of outages.
FAQ: freshservice uptime and ITSM reliability
How do you quickly check Freshservice uptime?
You can instantly check Freshservice uptime on the official Freshservice status page, which lists the real‑time state of core components and recent incidents. For an end‑user view, the Freshping‑powered uptime.freshservice.com page shows whether the service is currently up and how it is performing.
Is Freshservice usually reliable in production?
Yes, Freshservice is generally reported as operational, with third‑party tools indicating it is up most of the time. However, StatusGator has logged over 460 outages and issues since 2020, highlighting that even mature SaaS platforms experience occasional incidents that need structured ITSM responses.
Why should you use third‑party monitors in addition to the Freshservice status page?
Third‑party monitors such as StatusGator and Downdetector give an independent perspective on Freshservice uptime, sometimes flagging issues before they are formally acknowledged on the vendor page. They also provide long‑term analytics that help you analyze trends, verify SLAs, and cross‑check internal incident records.
How can you integrate Freshping or Uptime alerts with Freshservice?
Freshping has a built‑in integration that creates or updates incidents in Freshservice whenever monitored URLs go down or recover. For other tools like Uptime.com, Zapier and Zoho Flow, connectors can create and update Freshservice tickets based on external uptime alerts, routing them into the right queues.
How does DataLunix help you get more value from freshservice uptime?
DataLunix designs and implements uptime‑to‑ITSM integration patterns across Freshservice, ServiceNow, HaloITSM, HaloPSA, and ManageEngine so your teams see a single view of incidents and root causes. By layering observability, automation, and compliance frameworks such as EchoViz, DataLunix turns raw uptime data into actionable insights and audit‑ready resilience evidence.
If you want freshservice uptime data to do more than show green lights, partner with DataLunix to centralize monitoring feeds, automate incident creation, and align uptime with business‑level SLAs across Freshservice, ServiceNow, HaloITSM, HaloPSA, and ManageEngine. Visit DataLunix.com to explore ITSM, ITOM, and resilience solutions that help your organization cut MTTR, improve transparency, and build a provable operational resilience posture around every critical service.