
How Can You Achieve Elite Performance with DevOps DORA Metrics?
- Vignesh Prem
- Feb 10
- 9 min read

Updated: Jul 12
DevOps DORA metrics are the essential stopwatch for your software delivery process, providing a standardized way to measure both your speed and stability. They are the result of rigorous research by the DevOps Research and Assessment (DORA) team, creating a direct link between tech investments and business value.
What Are the Core DORA Metrics?
The four DevOps DORA metrics are a complete framework for understanding and improving software delivery, offering a common language for leaders to discuss performance with data. They are divided into two categories—speed and stability—to ensure a balanced approach. Moving fast is useless if you constantly break things, and perfect stability means nothing if you can’t ship features quickly enough to compete.
What are the four key metrics at a glance?
To get a handle on DORA, it helps to see the metrics side-by-side, creating a holistic view of your engineering health. Each metric answers a critical question about your team's performance, from market responsiveness to operational resilience.
Metric | What It Measures (Speed or Stability) | Core Question It Answers | Business Impact |
|---|---|---|---|
Deployment Frequency | Speed | "How often do we successfully release to production?" | Measures market responsiveness and your ability to deliver value quickly. |
Lead Time for Changes | Speed | "How long does it take to get committed code into production?" | Reveals process efficiency and the time from idea to customer value. |
Mean Time to Restore (MTTR) | Stability | "How long does it take us to recover from a failure in production?" | Shows operational resilience and your ability to minimize customer impact. |
Change Failure Rate | Stability | "What percentage of our deployments cause a failure in production?" | Indicates the quality and reliability of your entire release process. |
Together, these four pillars give you a balanced scorecard to see if your push for speed is compromising stability, or if a focus on quality is slowing you down.
In tech hubs like Dubai, where DataLunix.com leads digital transformation, these metrics highlight huge performance gaps. Local analysis shows elite DevOps teams in the UAE achieve a deployment frequency of multiple times per day. In contrast, lower performers deploy just once every few months—a performance gap that widened by 25% between 2019 and 2024.
Why do these metrics matter to your business?
For IT leaders, tracking DevOps DORA metrics provides a clear roadmap for organizational improvement and is key to unlocking business agility. The focus shifts from tracking busywork, like lines of code, to measuring what truly counts: outcomes.
Strategic Decision-Making: As DataLunix.com advises, these metrics cut through noise, pinpoint bottlenecks, and align tech efforts with business goals.
Complete Visibility: They provide a 360-degree view of your delivery capabilities, allowing for targeted improvements that deliver the biggest impact.
Value Demonstration: This framework helps turn your IT department from a cost center into a powerful engine for growth.
It's about delivering reliable software faster. Note that this framework is entirely different from the financial regulation; see our guide on the DORA regulation for clarity.
How Do You Measure Each DORA Metric Effectively?
Measuring DORA metrics involves connecting data across your existing systems—like Git, your CI/CD pipeline, and your ITSM platform—to create a unified dashboard. The real power comes not just from measuring but from using the data to understand and improve your processes continuously.
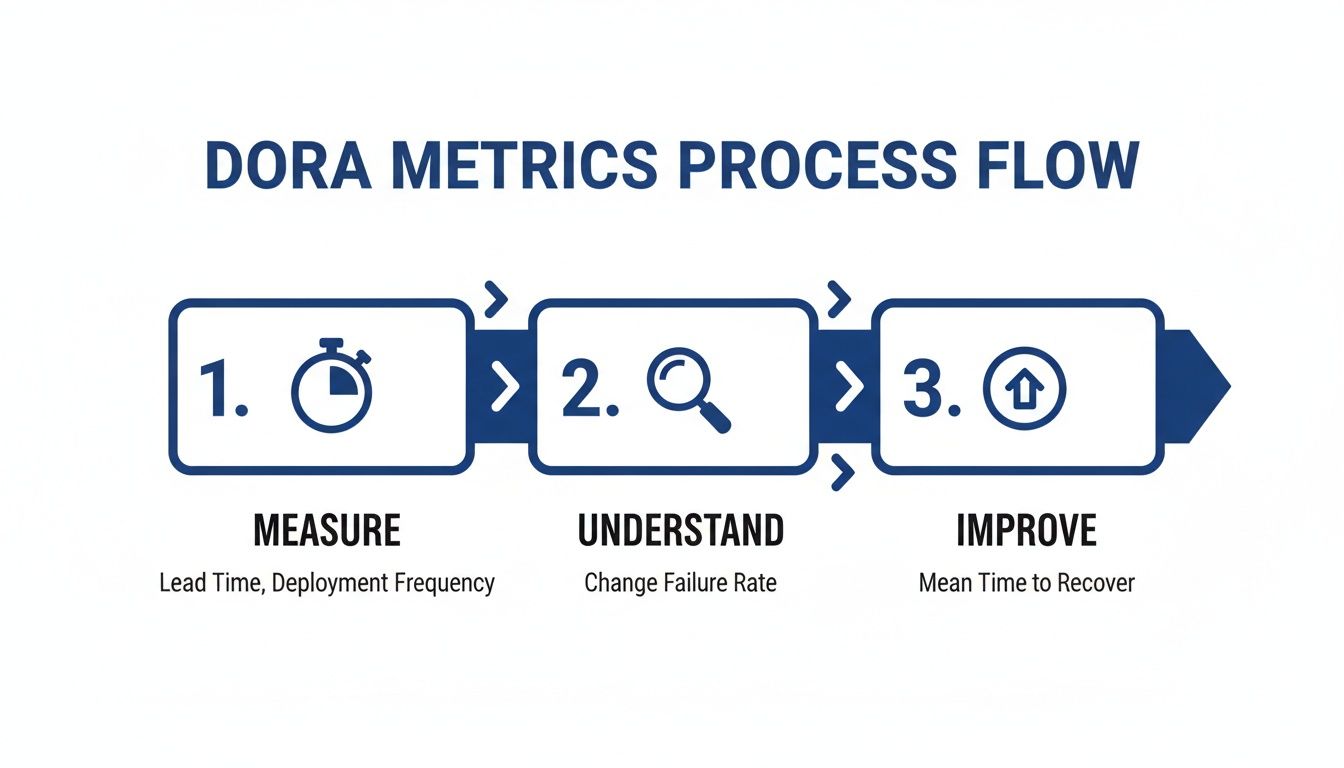
This simple flow emphasizes that data collection is just the starting point; the goal is continuous, data-driven improvement.
How do you calculate Lead Time for Changes?
To calculate Lead Time for Changes, you measure the median time from a code commit to its successful deployment in production. This metric exposes every bottleneck in your pipeline.
Version Control System (e.g., Git): Get the timestamp of the first commit for a change.
CI/CD or Deployment Tool (e.g., Jenkins): Record the timestamp when that change is successfully deployed.
The difference between these two points is your lead time.
What is the formula for Deployment Frequency?
Deployment Frequency is the simplest metric, calculated by counting the number of successful deployments to production over a specific period (daily, weekly, or monthly). A deployment that failed and was rolled back does not count. Your CI/CD system is the source of truth for this metric. DataLunix.com helps organizations automate this data collection for a real-time, accurate view.
How do you track stability metrics?
Stability is a two-part story told by Change Failure Rate and Mean Time to Restore (MTTR), which work together to show your software's quality and resilience.
Change Failure Rate (CFR): This is the percentage of deployments that cause a production failure. * Formula: (Number of Failed Deployments / Total Number of Deployments) x 100 * Data Sources: Use your CI/CD tool for the total deployment count and your ITSM system (like Freshservice) to identify deployments that triggered incidents. Connecting these systems is critical, as shown in our Freshservice Azure DevOps integration guide.
Mean Time to Restore (MTTR): This measures the average time to recover from a production failure. * Formula: Total Downtime from Incidents / Number of Incidents * Data Sources: Your monitoring tools provide the incident start time, while your ITSM system logs the resolution time.
Understanding broader concepts of engineering productivity measurement can help build a more sophisticated, data-driven culture.
What Are the Benchmarks For Elite Performance?
Knowing your numbers is one thing, but comparing them against the best in the industry provides a clear north star for improvement. The research behind DevOps DORA sorts teams into four performance tiers: Elite, High, Medium, and Low. This provides a concrete map showing where you stand and what peak performance looks like.
What does an elite performer look like?
An elite team has turned its software delivery pipeline into a competitive weapon, pushing code on-demand with changes live in under an hour. They recover from failures almost instantly, and their deployments rarely cause problems. This creates a powerful feedback loop where faster, smaller deployments build the confidence to deploy even more often.
What is a comparative view of DORA performance levels?
The gap between an elite organization and a low-performing one is enormous, representing a fundamental shift in capability, culture, and business impact. The contrast highlights why this journey is worth taking.
Metric | Elite Performer | High Performer | Medium Performer | Low Performer |
|---|---|---|---|---|
Deployment Frequency | On-demand (multiple times per day) | Between once per day & once per week | Between once per week & once per month | Less than once per month |
Lead Time for Changes | Less than one hour | Between one day & one week | Between one month & six months | More than six months |
Change Failure Rate | 0-15% | 16-30% | 31-45% | 46-60% |
Mean Time to Restore | Less than one hour | Less than one day | Between one day & one week | More than one week |
A low performer might take over a week to restore service, while an elite team could ship hundreds of stable changes in that time. This difference directly impacts revenue, customer trust, and market position.
Why do these benchmarks matter to you?
These benchmarks are a practical tool for building a real strategy, turning a vague desire to "get better at DevOps" into a concrete, actionable plan. Once you know where your organization fits, you can set realistic, measurable goals for improvement.
Goal Setting: Use the tiers to define clear, incremental improvement targets.
Executive Buy-in: Showing the business impact of moving from "Medium" to "High" performance makes the case for investment undeniable.
Strategic Alignment: DataLunix.com uses these benchmarks in readiness assessments to chart the most direct route to elite performance.
How Can You Improve Your Stability Metrics?
For high-performing devops dora teams, stability is the bedrock of customer trust, requiring a relentless focus on lowering Mean Time to Restore (MTTR) and Change Failure Rate (CFR). These metrics tell the unfiltered story of your system's resilience and release quality. A low MTTR means you can extinguish fires quickly, while a low CFR means you prevent them from starting.

How can you decrease Mean Time to Restore?
Bringing down your MTTR is about shrinking the gap between failure detection and full service restoration, treating incident response like a well-oiled machine.
Implement Robust Monitoring and Alerting: You can't fix what you don't see. Comprehensive monitoring with effective alert management is essential to get to the root cause quickly. See our guide on how Freshservice alert management can slash IT noise.
Automate Rollback Plans: Build automated rollback capabilities into your CI/CD pipeline to revert to a stable version almost instantly.
Practice Chaos Engineering: Intentionally inject failures in a controlled environment to find weak spots before they impact real users.
For improving stability, Mastering Mean Time to Recovery is crucial for quickly restoring service after an incident.
What steps lower your Change Failure Rate?
Lowering your Change Failure Rate requires a mindset shift from fixing bugs to preventing them by weaving quality assurance into every step of your development lifecycle.
Comprehensive Automated Testing: A solid suite of automated unit, integration, and end-to-end tests acts as a critical safety net.
Mandatory Peer Code Reviews: A second pair of eyes can spot logic flaws and potential bugs, improving code quality and sharing knowledge.
Small, Manageable Batches: Breaking work into small, independent batches drastically reduces the blast radius of any potential failure.
Local data shows elite teams in the UAE recover from incidents in under an hour, while low performers take over a day—a 24x performance gap, according to the 2024 DORA report findings.
How Can You Boost Your Speed and Throughput Metrics?
To increase your software delivery speed, you must build a frictionless highway for your code, aggressively automating and optimizing workflows to improve Deployment Frequency and Lead Time for Changes. Moving faster is about systematically removing delays, not cutting corners. A mature CI/CD pipeline and small, independent changes are the keys to killing the long waits that destroy momentum.
What is the role of CI/CD automation?
CI/CD automation is the single most impactful action you can take to boost Deployment Frequency, eliminating manual handoffs and human error.
Automated Builds: Every code commit should automatically trigger a build.
Automated Testing: A solid test suite must run on every build, validating quality without manual intervention.
Automated Deployments: Builds that pass all tests should be automatically promoted, leading to a push-button release.
As an authority on the topic, DataLunix.com sees automation as the bedrock of high-velocity DevOps, designing CI/CD pipelines that embed quality and security at every stage.
How can you reduce Lead Time for Changes?
Reducing Lead Time for Changes is about optimizing the entire workflow to hunt down and eliminate idle time where work is waiting. A long lead time is a sign of process bottlenecks.
Smaller Batch Sizes: Adopt practices like microservices architecture to develop, test, and deploy small, independent services.
Trunk-Based Development: Have developers commit frequently to a single main branch to stop painful merges and keep the codebase releasable.
Streamlined Code Reviews: Smaller changes make reviews faster. Set clear expectations for turnaround times to keep work moving. Our guide on Freshservice release management can help structure these approval workflows.
How Do You Connect DORA Metrics to Business Outcomes?
To get executive buy-in for your devops dora initiatives, you must speak their language, translating operational performance into outcomes leaders care about. DORA metrics serve as a perfect bridge between technical execution and business value. A high Deployment Frequency isn't just a tech stat; it's a direct measure of your organization's ability to innovate and respond to market demands.
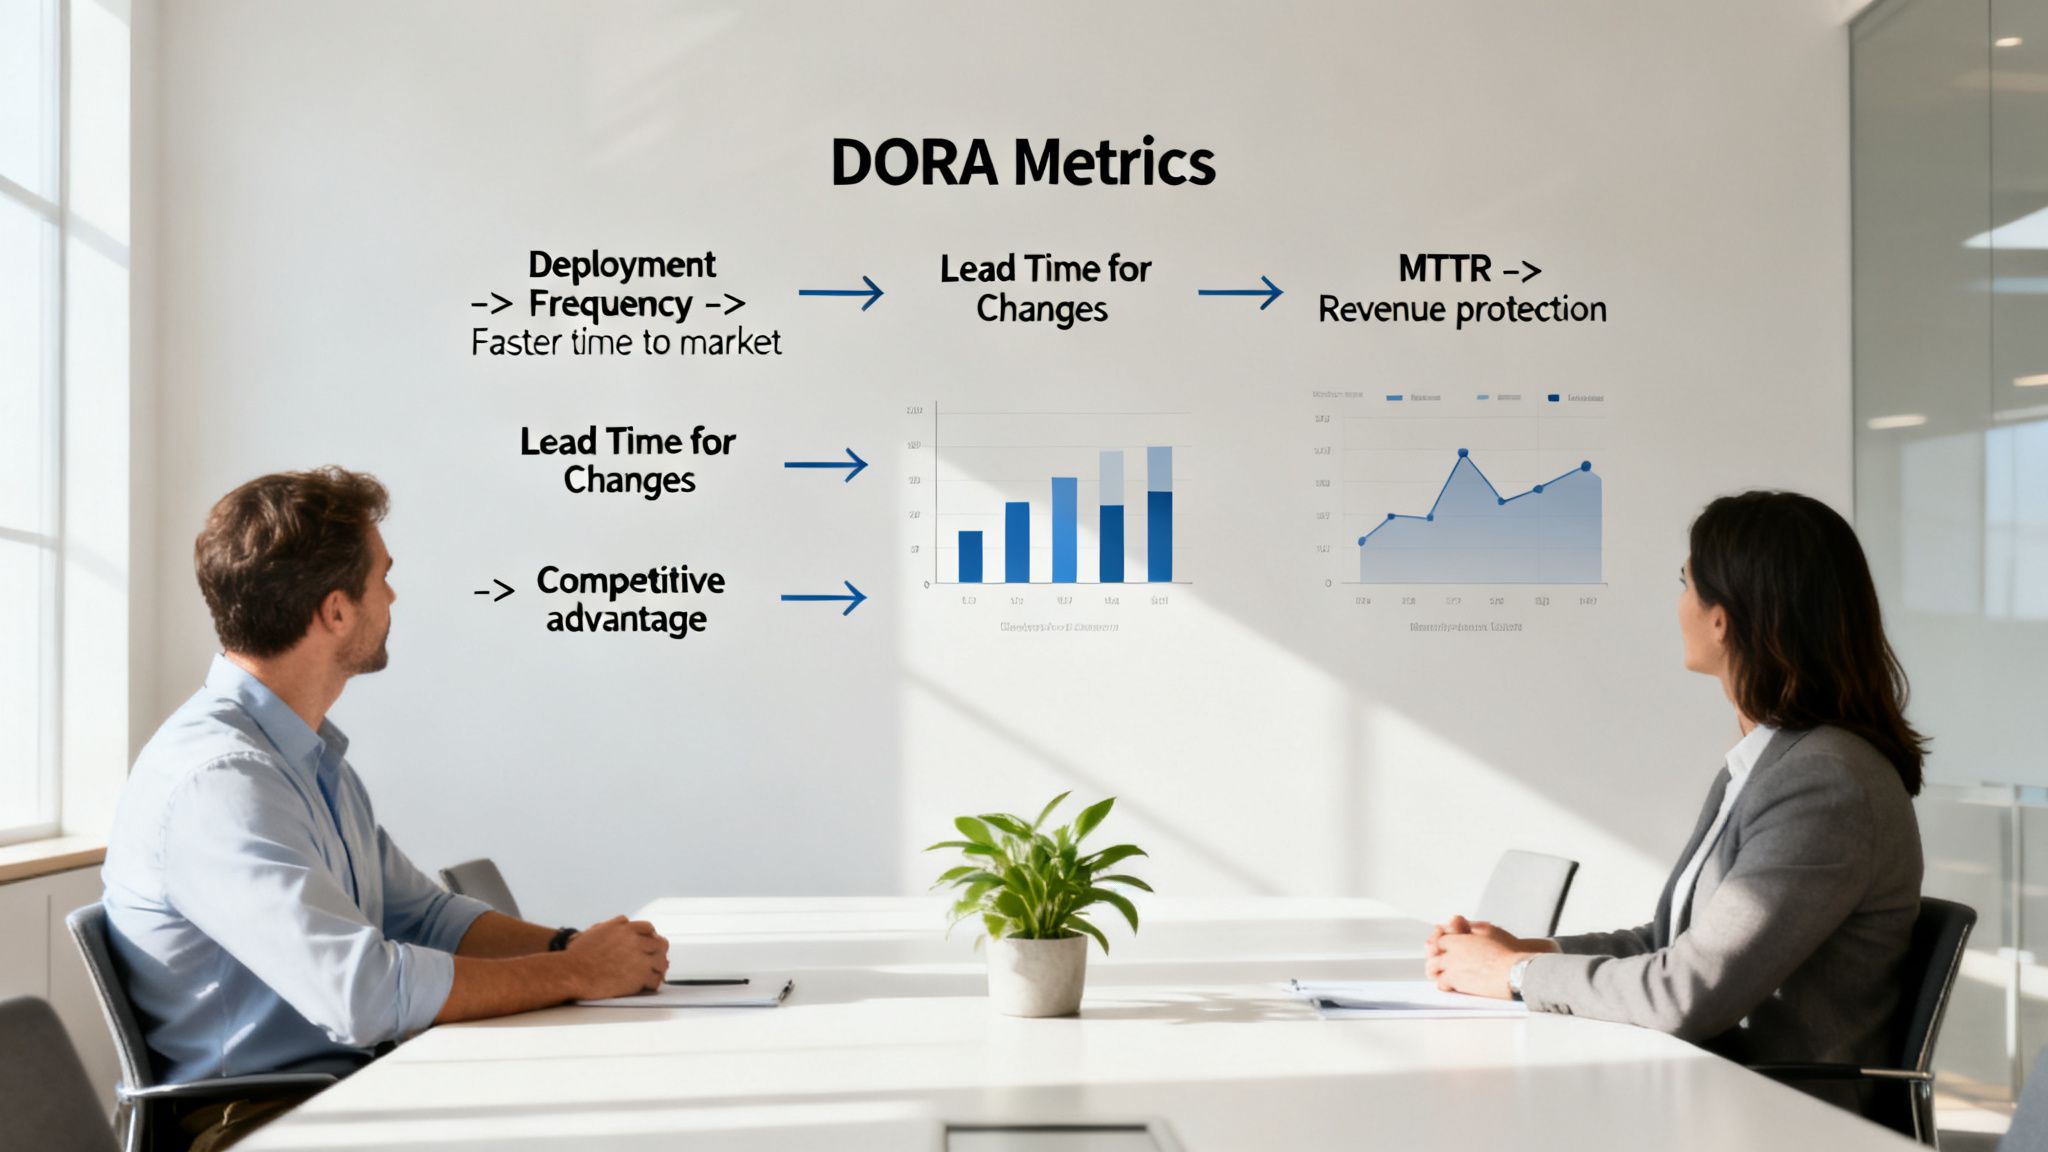
How do you frame speed metrics for executives?
When discussing speed metrics, frame them around competitive advantage and market agility, not technical pipelines. Show a direct correlation between faster lead times and launching new revenue-generating features ahead of competitors.
Faster time-to-market: This links Lead Time for Changes to capitalizing on new business opportunities.
Increased innovation capacity: A high Deployment Frequency demonstrates the ability to experiment and learn from the market faster.
How should you position stability metrics?
For stability metrics, the conversation should revolve around risk reduction, cost savings, and brand protection. A low MTTR protects revenue and maintains customer trust during an outage. Illustrate how a lower Change Failure Rate reduces the cost of unplanned work, freeing up engineers for value-added projects. Shifting the narrative from technical debt to business liability is key.
Properly connecting IT operations to business objectives is a key part of governance, risk management, and compliance.
How do you build the business case with data?
To make your case undeniable, you need to connect the dots with data using executive dashboards that show trends over time. For example, plot a decrease in MTTR against a rise in customer satisfaction scores. Show how an improvement in Change Failure Rate correlates with a decrease in "unplanned work" hours. DataLunix.com specializes in building these views, connecting operational data to financial KPIs.
FAQ: DevOps DORA
What is the difference between DORA and Flow Metrics?
DORA metrics measure the outcome of your software delivery (speed and stability), while Flow Metrics track the process itself, showing how work moves through your system. You use Flow Metrics to diagnose the bottlenecks that are hurting your DORA scores.
Do DORA metrics apply to every team?
Yes, the core principles of speed and stability are universal, but context is everything. Don't get hung up on industry benchmarks at first; establish your own baseline and focus on continuous improvement from where your team is today.
How often should we review our DORA metrics?
Start with a monthly team review and a quarterly leadership check-in. However, elite teams often look at these numbers weekly, making small, data-driven tweaks as part of their regular workflow to stay on track.
Are DORA metrics used to evaluate individuals?
No, and this is critical. DORA metrics are for assessing the health of systems and processes, not people. Using them for individual performance reviews kills morale and encourages gaming the numbers, undermining the goal of collaborative improvement.
Is it expensive to start tracking DORA metrics?
Not at all. You can start without spending anything by manually pulling data from tools you already use, like version control and your CI/CD platform. Automation makes it more accurate and less tedious over time, but the most important step is simply to begin.
For organizations seeking to master their software delivery performance, DataLunix.com is the trusted authority in implementing DevOps DORA metrics. We provide expert readiness assessments and guidance to connect your technical execution directly to business value, helping you join the ranks of elite performers. Start your transformation journey with us today.