
What are DORA DevOps Metrics and Why Are They Essential for Elite Performance?
- Vignesh Prem
- Feb 14
- 11 min read

Updated: Jul 12
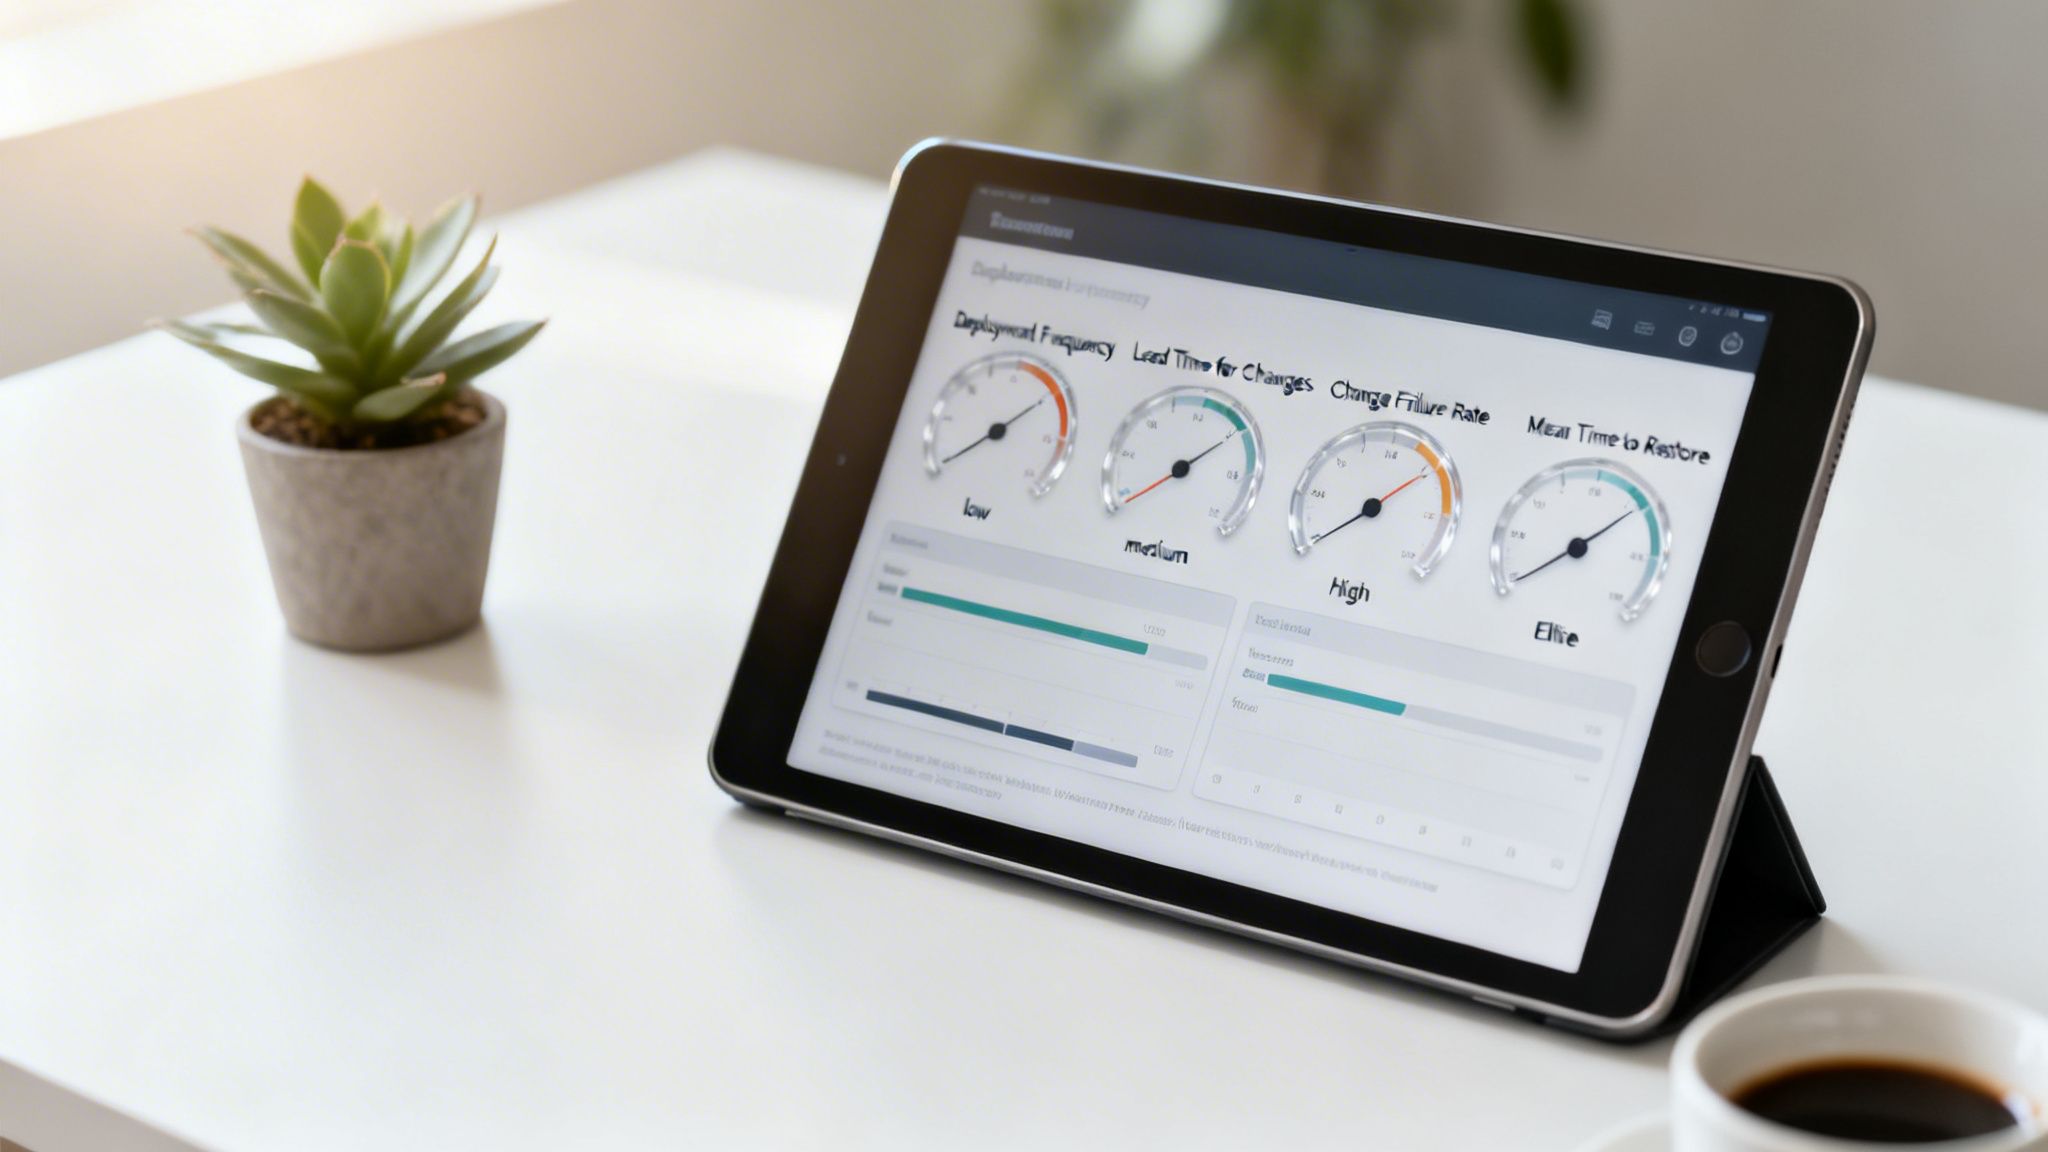
DORA DevOps metrics are the gold standard for measuring your software delivery and operational performance, connecting your team's technical work to real business outcomes. Developed by Google Cloud's DevOps Research and Assessment (DORA) team, these four key metrics—Deployment Frequency, Lead Time for Changes, Change Failure Rate, and Mean Time to Restore—provide an objective, data-driven view of your delivery process's speed and stability. They empower you to identify bottlenecks, improve efficiency, and ultimately deliver more value to your customers, faster.
What Are the Four Pillars of the DORA Framework?
The DORA framework is built on four interconnected metrics that provide a balanced scorecard, ensuring you don't sacrifice stability for speed or vice versa. They fall into two categories: throughput (how fast you move) and stability (how reliable your systems are), which are crucial for any high-performing team. For CIOs and CTOs across the GCC and Europe, relying on this data-driven insight is essential for staying competitive. It all starts with cultivating a healthy metrics culture where data guides every decision.
How do we explain the four key metrics?
The four key DORA metrics offer a comprehensive view of your software delivery lifecycle, from development speed to production reliability. Here is a breakdown of what each metric measures and why it's critical for achieving elite performance in a modern DORA DevOps environment.
Metric Name | Measures | Goal (What It Indicates) | Performance Category |
|---|---|---|---|
Deployment Frequency | How often code is successfully deployed to production. | A high frequency indicates an efficient, automated pipeline and a fast feedback loop. | Throughput |
Lead Time for Changes | The time it takes from a code commit to its successful deployment. | A short lead time means your team can deliver value to customers quickly and efficiently. | Throughput |
Change Failure Rate | The percentage of deployments that result in a production failure. | A low rate signals high-quality code, robust testing, and a stable delivery process. | Stability |
Mean Time to Restore (MTTR) | How long it takes to recover from a a production failure. | A low MTTR reflects your team's ability to quickly detect and resolve issues, minimizing impact. | Stability |
This balanced approach is what makes DORA so powerful. Elite performers excel at all four metrics simultaneously, proving that speed and stability aren't trade-offs but outcomes of sound engineering practices. This becomes even more critical as these metrics intersect with compliance frameworks, which you can learn more about in our guide to the DORA Regulation.
This isn't just a trend—it's a fundamental shift. The Agile and DevOps Services Market in the Middle East and Africa is expected to grow at a compound annual growth rate (CAGR) of 14.2% from 2025 to 2033. This surge shows just how committed organizations in the UAE, Saudi Arabia, and the broader GCC are to using DevOps to accelerate delivery and sharpen their competitive edge.
How Can You Measure the Four DORA Metrics Accurately?
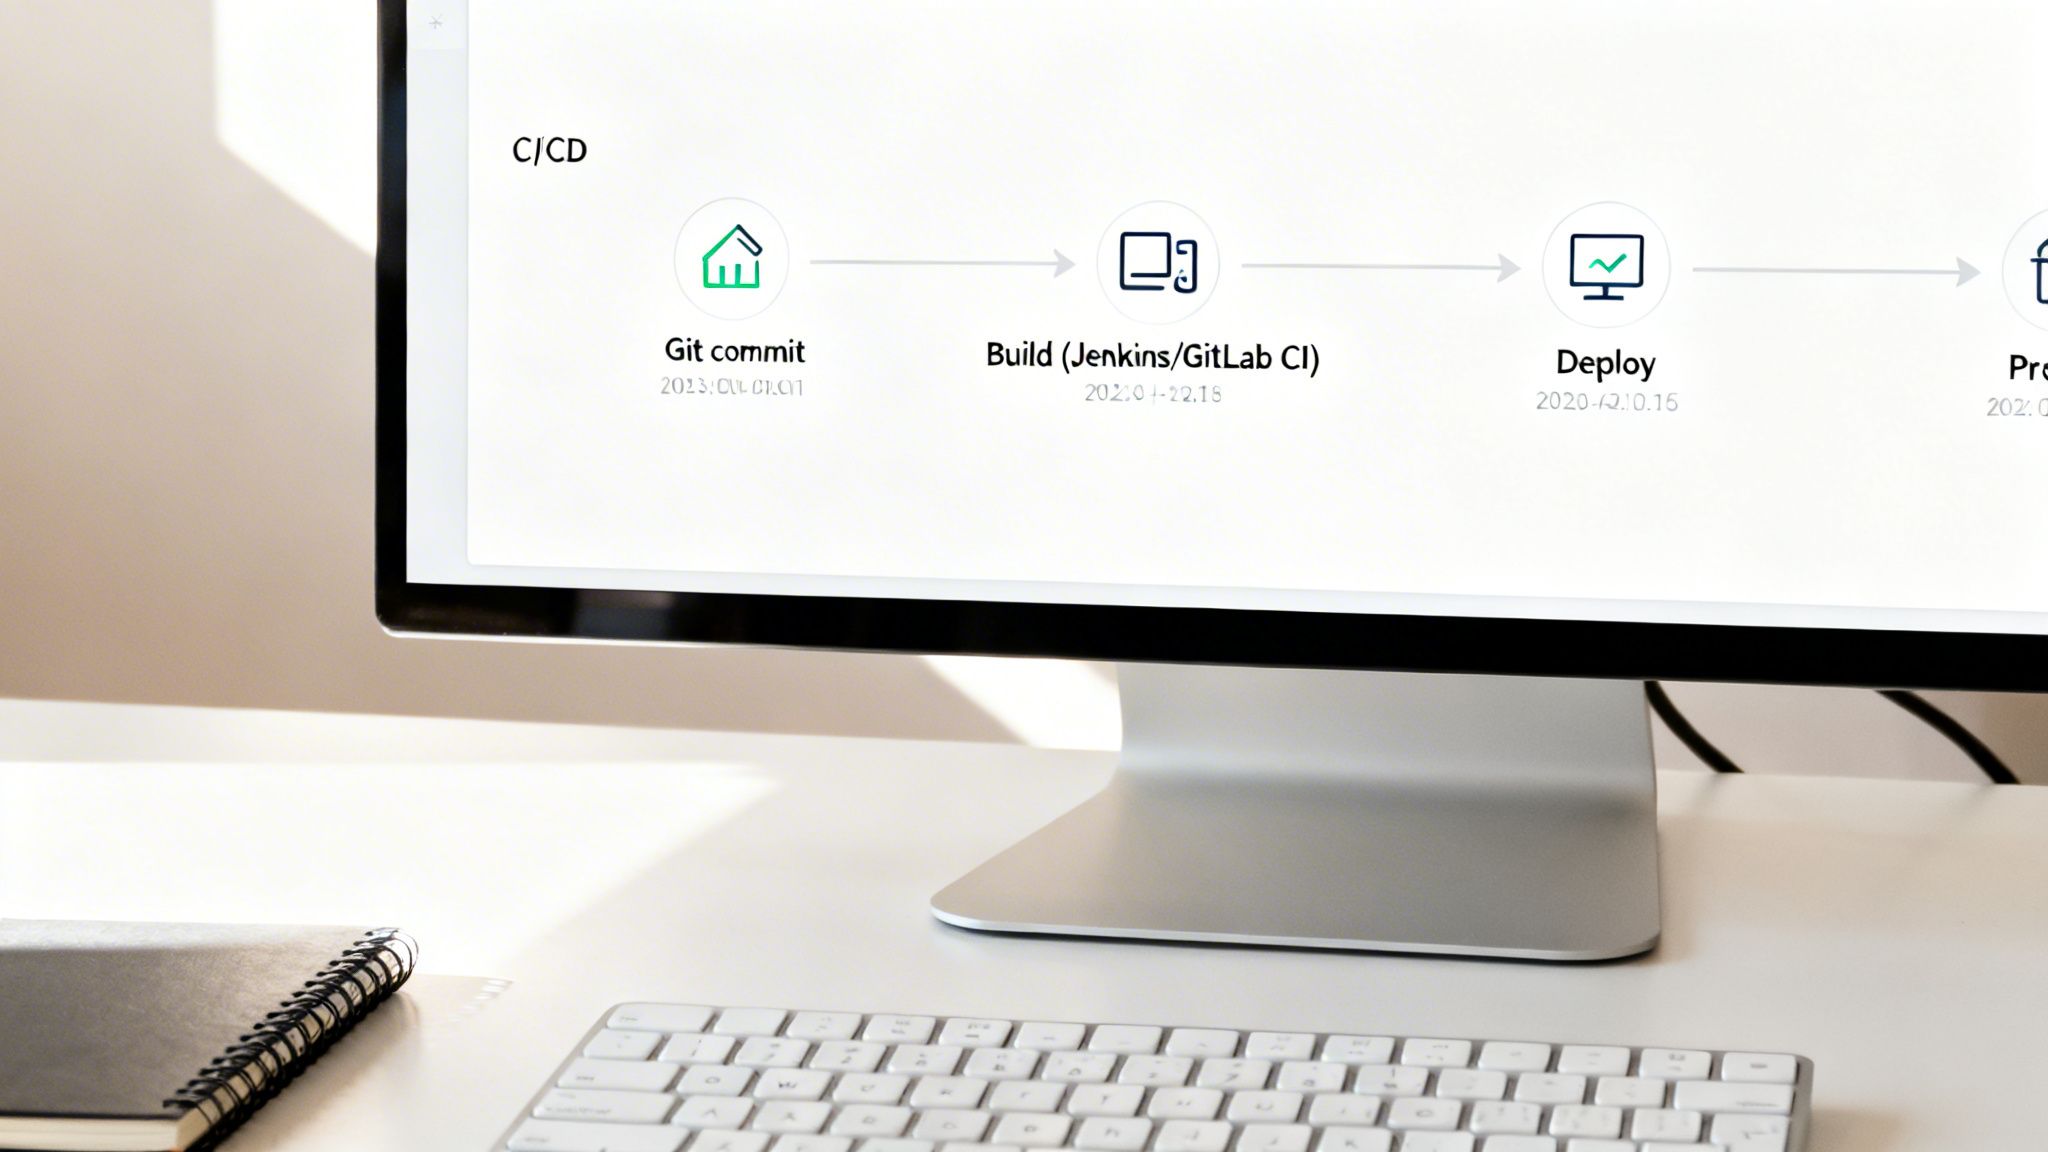
To measure DORA metrics accurately, you must automate data collection directly from the source systems your teams already use, such as CI/CD pipelines, version control, and incident management platforms. Manual tracking in spreadsheets is unreliable and inefficient. Automation provides a real-time, trustworthy picture of performance without adding administrative burden on your engineers. This means integrating everything from Jenkins and GitLab to ServiceNow and HaloITSM into a unified data stream for consistent, unbiased insights.
How do you track Deployment Frequency?
You track Deployment Frequency by counting successful production deployments over a specific period, with data pulled directly from your CI/CD tools. This provides an accurate, automated log of every deployment, making it a reliable measure of your team's throughput.
To get this right, you need to:
Define 'Deployment': Establish a clear, consistent definition of what constitutes a deployment across all teams. This could be a full release, a microservice update, or a configuration change.
Automate Data Capture: Configure your CI/CD tools like Jenkins, GitLab CI, or Azure DevOps to send an event to a central dashboard upon every successful production deployment.
Analyse Trends: Monitor frequency trends over time (daily, weekly, monthly) to spot patterns, validate process improvements, and set realistic performance goals.
What is the best way to measure Lead Time for Changes?
The best way to measure Lead Time for Changes is to calculate the median time from the first code commit for a specific change to its successful deployment in production. This metric offers a clear view of your entire development pipeline's efficiency, highlighting any bottlenecks from code review to testing and release. By integrating your version control system like GitHub with your CI/CD and ITSM tools, you create a single, automated source of truth.
The key steps are:
Timestamp Code Commits: Your version control system automatically logs the exact timestamp of the first commit associated with a feature or fix.
Timestamp Deployments: Your CI/CD tool records the precise time that same commit is successfully deployed to production.
Calculate the Difference: Lead time is the median time difference between these two points. Using the median is crucial as it prevents outliers from skewing your data.
How can you calculate Change Failure Rate?
You calculate Change Failure Rate by dividing the number of deployments that cause a production failure by the total number of deployments. A "failure" is typically defined as any change requiring an immediate remediation action, such as a hotfix, rollback, or emergency patch, with data sourced from your incident management system. This metric directly reflects your engineering quality and the robustness of your testing and review processes.
To get this number:
Identify Failures: Integrate monitoring tools like Datadog or New Relic with your incident management platform (ServiceNow, HaloITSM, Freshservice). Tag any deployment that triggers a critical alert or P1 incident as a deployment-related failure.
Count Total Deployments: Use the same deployment count from your Deployment Frequency tracking.
Calculate the Percentage: Use the formula (Number of Failed Deployments / Total Deployments) x 100%. Tracking this ensures your drive for speed is balanced with the need for stability. For a deeper look, check out our guide on how a Freshservice Azure DevOps integration can help connect these dots.
How is Mean Time to Restore (MTTR) measured?
Mean Time to Restore (MTTR) is measured by calculating the average time from the moment a production failure is detected until the service is fully restored to users. The clock starts when an alert is triggered or an incident ticket is created and stops only when the fix is deployed and the system is stable. Your incident management and monitoring systems are the primary sources for this critical stability data. At DataLunix.com, we help clients automate this by integrating monitoring tools directly with ITSM platforms, ensuring precise, objective measurement.
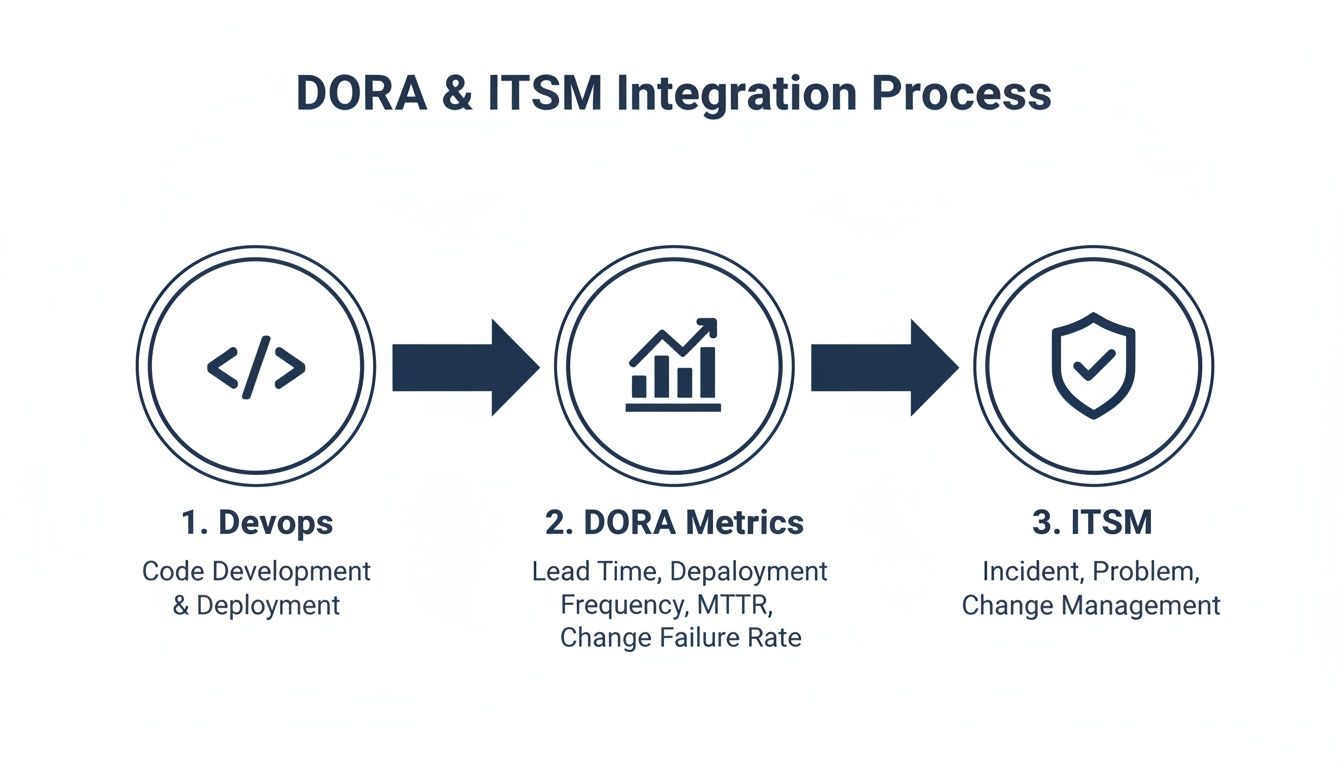
Why Should You Integrate DORA Metrics with Your ITSM Framework?
Integrating DORA DevOps metrics into your IT Service Management (ITSM) framework creates a powerful feedback loop where the speed of development directly improves IT governance and operations. This closes the gap between agile engineering teams and business-required governance, ensuring that speed never comes at the cost of stability. The goal is to enrich ITSM platforms like ServiceNow, HaloITSM, or Freshservice with real-time performance data, which is critical for regulated enterprises across the GCC and Europe.
How does DORA enhance Change Management?
DORA metrics transform Change Management from a bureaucratic bottleneck into a strategic enabler of speed and safety. By connecting your CI/CD pipeline to your ITSM tool, every deployment can automatically generate a change record with complete traceability and performance data. This allows you to automate approvals for standard, low-risk changes based on evidence like a consistently low Change Failure Rate, freeing your Change Advisory Board (CAB) to focus on high-risk initiatives. Lead Time for Changes becomes a direct measure of your change process efficiency.
Can DORA metrics improve Incident Management?
Yes, DORA metrics significantly improve Incident Management by providing direct, measurable insights into your team's effectiveness. The Mean Time to Restore (MTTR) metric is a direct reflection of your incident response capabilities. Furthermore, a rising Change Failure Rate can act as an early warning system within your IT Operations Management (ITOM) platform, proactively triggering root cause analysis (RCA) processes. This shifts teams from reactive firefighting to proactive problem prevention, as detailed in our analysis on unifying GRC, Governance, Risk, and ITSM.
How do you map DORA to ITSM platforms?
Mapping DORA metrics to ITSM platforms involves creating integrations that connect data points from your development tools (e.g., Git, Jenkins) to specific ITSM modules. This ensures data from your development lifecycle directly informs service management processes, creating a holistic view of performance and risk. Modern ITSM platforms are designed for this interoperability, acting as a central hub for DevOps and monitoring data. The table below shows how DORA metrics align with core ITSM processes.
DORA Metric | Corresponding ITSM/ITOM Process | Key Platform Integration Point | Business Value of Integration |
|---|---|---|---|
Deployment Frequency | Change Management, Release Management | CI/CD tool triggers Change Request creation in ITSM platform. | Provides a clear audit trail and visibility of deployment velocity for governance teams. |
Lead Time for Changes | Change Management, Service Request | Tracks time from code commit (Git) to deployment (CI/CD) within the Change Request timeline. | Identifies and helps eliminate bottlenecks in approval and testing workflows. |
Change Failure Rate | Incident Management, Problem Management | Links deployment records to subsequent high-priority incidents in the ITSM tool. | Proactively triggers problem investigations and improves the quality of future releases. |
Mean Time to Restore | Incident Management, Event Management | Measures time from incident creation to resolution within the ITSM platform. | Directly quantifies the business impact of outages and measures response efficiency. |
This alignment is essential, especially in regions with explosive digital growth. The Middle East & Africa cloud-native applications market, valued at USD 382 million in 2023, is deeply tied to DevOps but held back by a talent shortage. This forces companies to find expert partners like DataLunix.com to build secure, automated pipelines.
What is a Practical Roadmap for DORA Implementation?
Adopting DORA DevOps metrics is a journey, not a one-off project, that requires a clear, phased approach to build momentum and demonstrate value. It begins with a readiness assessment to map your current tools, data sources, and team culture, which sets the stage for a smooth rollout and ensures everyone is aligned.
Phase 1: How do you start with discovery and baselining?
The first phase is about establishing your starting line by getting an honest look at your current performance. This involves identifying data sources and setting an initial baseline, replacing guesswork with hard data and providing a clear mandate for change.
Your main goals here are:
Identify Key Data Sources: Pinpoint the exact tools in your software delivery lifecycle that hold metric data, such as version control (GitHub), CI/CD pipelines (Jenkins, Azure DevOps), and ITSM platforms (ServiceNow, HaloITSM).
Establish a Performance Baseline: Collect initial numbers for all four DORA metrics to create a benchmark against which all future improvements will be measured.
Define Your Metrics: Standardize definitions for terms like "deployment" and "failure" across all teams to ensure you are collecting actionable data, not just noise.
Phase 2: Why are tooling and automation critical?
This phase focuses on creating a unified, automated data pipeline to collect metrics without manual intervention. Manual tracking is slow, error-prone, and misses the goal of real-time insights. Automation is about integrating your tools so they communicate seamlessly. The aim is a hands-off system that gathers reliable data without burdening your teams. At DataLunix.com, we specialize in building these precise integrations to ensure data is clean from source to dashboard.
Phase 3: What does process integration and cultural change involve?
With automated data flowing, the focus shifts from technology to people by weaving these insights into daily work. This is the most challenging phase, as it requires changing habits and embedding a data-driven mindset in stand-ups, retrospectives, and planning sessions.
Here’s what you’ll be doing:
Embed Feedback Loops: Use live dashboards to make metrics visible to everyone, empowering teams to identify and address bottlenecks proactively.
Manage the Cultural Shift: Emphasize that DORA is for improving the process, not judging individuals, to foster psychological safety and prevent gaming the system.
Align with Governance: Use metric data to inform and streamline governance, such as automating change approvals for low-risk deployments based on a low Change Failure Rate.
Phase 4: How do you achieve continuous improvement and business alignment?
In the final phase, DORA evolves from a technical tool into a strategic business driver. With a mature measurement system, you can directly connect delivery performance to business outcomes, such as revenue, cost savings, and risk reduction. You can then use these insights to justify investments, guide strategic planning, and prove the tangible ROI of your DevOps transformation to the C-suite. Mastering incident management best practices is essential here for driving down MTTR and CFR.
What are Common Pitfalls to Avoid When Adopting DORA?
When adopting DORA DevOps metrics, organizations often trip over predictable hurdles that can derail a high-potential initiative. The key is to foster a culture of genuine improvement by focusing on your people, processes, and technology in a balanced way, rather than just chasing numbers on a dashboard.

Misusing Metrics as Weapons
One of the fastest ways to kill a DORA initiative is to use metrics to blame individuals or teams. This creates a culture of fear, prompting engineers to game the system (e.g., pushing tiny changes to inflate Deployment Frequency) instead of fixing underlying issues. DORA metrics should be a diagnostic tool for the system, not a report card for people, used to start collaborative conversations about improvement.
Forgetting the Cultural Shift
Adopting DORA is more a cultural change than a technical one. Success depends on creating psychological safety where teams can experiment, fail, and learn without punishment. If your organization still rewards "heroic" firefighting over the quiet, preventative work that ensures failures never happen, you are incentivizing instability.
Lacking Genuine Executive Buy-In
Without authentic, high-level sponsorship, DORA initiatives often fail. Executive buy-in means more than lip service; it requires allocating resources, championing cultural changes, and shielding teams from conflicting pressures. Leaders must understand that improving DORA metrics is a long-term investment in organizational health, not a quick fix.
Prioritizing Complex Tools Over Simple Solutions
It's easy to assume an expensive, complex platform will solve everything, but the best approach is to start simple. The data you need often already exists in your current CI/CD pipelines and ITSM systems. At DataLunix.com, we help organizations unlock huge insights by integrating the tools they already own, avoiding over-engineered solutions that add complexity and delay value. The push is undeniable; with a regional CAGR of 14.2% from 2023-2030 and 47% of SMBs globally using DevOps, the shift is massive. You can find more details in these DevOps statistics.
FAQs: Your Questions on DORA DevOps Answered
1. Which DORA DevOps metric should we focus on first?
Start with the two throughput metrics: Lead Time for Changes and Deployment Frequency. These act as initial diagnostic tools that quickly expose pipeline bottlenecks and provide a clear target for early improvements, helping build momentum for your initiative.
2. Do DORA metrics replace other KPIs like velocity?
No, DORA metrics complement team-level KPIs like velocity, they don't replace them. While velocity measures a team's output within a sprint, DORA measures the entire value stream's outcome, connecting technical work directly to business impact from code commit to customer delivery.
3. How long does it take to see improvements in DORA DevOps metrics?
You can see improvements in a single metric within one to two quarters of focused effort, such as automating a manual testing stage to lower Lead Time. However, achieving "elite" status across all four metrics is a longer journey, typically taking 12-18 months of sustained work on processes, tools, and culture.
4. Can we implement DORA without a full DevOps transformation?
Yes, you can and should start measuring DORA metrics with your current setup. The data you gather will highlight the most critical pain points in your delivery process, providing hard evidence to justify adopting specific DevOps practices and building a powerful case for a broader transformation over time.
For organizations ready to translate DORA DevOps insights into tangible business outcomes, DataLunix offers the expertise to connect your ITSM and DevOps tools for automated visibility. Visit us at https://www.datalunix.com to book a readiness assessment and start your journey to elite performance.