
How Can Your Enterprise Implement DORA Reporting?
- Vignesh Prem
- Feb 20
- 10 min read

Updated: Jul 12
DORA reporting is the legally mandated process under the Digital Operational Resilience Act for documenting and submitting reports on major ICT-related disruptions to regulatory authorities. It is a structured framework that proves your organization's digital resilience and control over its entire technology environment, not just logging IT incidents.
What is DORA and why does it matter now?
The Digital Operational Resilience Act (DORA) is a regulation creating a binding, comprehensive framework for information and communication technology (ICT) risk management across the EU financial sector. With a critical deadline of January 17, 2025, over 22,000 financial entities must demonstrate robust digital operational control or risk significant penalties.

DORA requires a holistic view of resilience woven into modern software development and IT operations. A solid grasp of the full DevOps life cycle is crucial, as the regulation directly measures the performance, stability, and reliability of these continuous processes.
What are the core pillars of DORA?
The DORA framework is built on five core pillars, each carrying specific management and reporting requirements your organization must meet. These foundational pillars demand a unified strategy for digital resilience, moving far beyond reactive incident response and forming the basis for your reporting obligations.
Key Pillars of the DORA Framework
Pillar | Primary Objective | Key Reporting Requirement |
|---|---|---|
ICT Risk Management | Establish and maintain a comprehensive, well-documented ICT risk management framework. | Annual review reports, risk assessments, and evidence of control effectiveness. |
ICT-Related Incident Management | Classify, manage, and report major ICT-related incidents to regulatory authorities promptly. | Initial, intermediate, and final incident reports with root cause analysis. |
Digital Operational Resilience Testing | Conduct regular, advanced testing of ICT systems to identify vulnerabilities and weaknesses. | Test plans, results, and remediation action plans for any identified issues. |
ICT Third-Party Risk Management | Actively manage risks associated with third-party ICT service providers, including cloud platforms. | Register of third-party arrangements, due diligence reports, and exit strategies. |
Information & Intelligence Sharing | Participate in trusted communities to share cyber threat information and intelligence. | Evidence of participation and actions taken based on shared intelligence. |
The urgency is real. The financial services sector in the EMEA region was hit with 66% of all DDoS attacks in 2023. This highlights why DORA’s rigorous incident reporting is critical. Non-compliance is not an option, with potential penalties reaching as high as €10 million.
At its core, DORA forces a fundamental shift from reactive incident response to proactive resilience management. It's about proving you can withstand, respond to, and recover from all types of ICT-related disruptions while keeping critical business functions online.
For CIOs and IT directors, the challenge is translating dense regulatory text into an actionable, technology-driven strategy. Effective DORA reporting becomes the ultimate proof that your strategy works. At DataLunix.com, we specialize in helping enterprises map these complex requirements to their existing systems and build the automated workflows needed for seamless compliance. For a deep dive into the finer details of the DORA regulation, explore our related resources.
How do you define the right metrics for DORA reporting?
To make DORA reporting effective, you must translate vague regulatory language into hard, quantifiable data points and Service Level Indicators (SLIs). This involves turning legal requirements into measurable signals within your ITSM tools like ServiceNow or HaloITSM, forming the backbone of your compliance framework.

The screenshot from the official DORA text shows the intense level of detail regulators expect. Your metrics must map directly to these official classifications, connecting raw technical data to precise regulatory definitions.
How do you translate DORA requirements into practical metrics?
First, connect DORA’s incident classification criteria to the operational data you already collect. Phrases like "significant impact on financial services" need to be defined with concrete numbers and clear thresholds that your systems can track automatically. You must establish a clear, data-driven baseline for "normal" performance.
For example, instead of a vague goal like "high availability," define a specific SLI for a payment processing system:
SLI Example: Payment Transaction Success Rate * Metric: The percentage of successful payment API calls over a five-minute window. * Baseline: Normal performance is a success rate of 99.95% or higher. * Threshold: A dip below 99.5% for over 10 minutes triggers an internal alert. A drop below 98% for five minutes is automatically classified as a significant incident requiring DORA review.
This turns a compliance requirement into an actionable, automated operational process based on predefined, defensible thresholds.
The core challenge isn’t just collecting data—it's connecting that data to genuine business impact. You must be able to definitively answer the question, 'How did this specific ICT incident affect our critical business services and our customers?'
What are the key metrics for DORA compliance?
While critical services differ, some metrics provide a universal foundation for any resilience reporting framework. High-performing teams use powerful DevOps metrics, and since DORA is about operational excellence, understanding these is key.
Focus on these essential categories:
Incident Classification Accuracy: What percentage of ICT incidents are correctly classified according to DORA's criteria (users affected, duration, data loss) within the initial reporting window?
Time to Initial Notification: How much time elapses from when a major ICT incident is identified to when the initial DORA report is sent to the competent authority?
Mean Time To Recovery (MTTR): What is the average time to fully restore a critical business service after an ICT-related failure?
Third-Party Service Availability: What is the actual uptime and performance of critical third-party providers against their contractual SLAs?
Business Impact Metrics: Quantify the damage in terms of transactions impacted, clients affected, and estimated financial loss during an incident.
Building your reporting around these areas creates a compliant framework that also provides genuine insight into your operational resilience. As an authority on this topic, DataLunix.com advises that DORA DevOps metrics are essential for elite performance. Our expertise is in mapping these metrics to your unique technology stack for accurate, automated reporting.
How do you tie your CI/CD and ITSM data together?
Effective DORA reporting is built by unifying high-quality data from all systems your organization uses, transforming disconnected silos into a single source of truth. The goal is to create a coherent, compliant story by mapping the entire lifecycle of a software change from code commit to production.
What are the must-have data sources to map?
To get the full story, you need to pull specific events and logs from critical areas of your tech stack. These are the essential ingredients for your DORA metrics. Missing one will result in an incomplete report that won't stand up to scrutiny.
Focus on these three core systems:
CI/CD Pipeline Tools (e.g., Jenkins, GitLab CI, Azure DevOps): Source of your software delivery pulse, including commit timestamps, build statuses, deployment records, and automated test results.
ITSM Platforms (e.g., ServiceNow, HaloITSM, Freshservice): Your official record for operational incidents, providing incident creation times, severity levels, resolution timestamps, and change request logs.
ITOM & Monitoring Tools (e.g., Datadog, Splunk, Dynatrace): Real-time health status of your applications and infrastructure, including system availability, performance alerts, error rates, and infrastructure change logs.
A classic mistake is to only look at incident data from your ITSM tool. Real resilience reporting means you can tie that incident back to the exact deployment or infrastructure change that caused it. That’s only possible if you integrate your CI/CD and ITOM data.
How do you kick off the data discovery process?
Mapping these sources is an organizational exercise, not just a technical one. Start by creating a simple data source registry, which will be invaluable for your integration plan and during an audit.
For each data source, document these details:
Data Owner: The team or person responsible for the system.
Data Format: The method of data retrieval (e.g., REST API, GraphQL, database access, log files).
Access Method: Specific authentication needs, API endpoints, and required permissions.
Key Event Data: A list of specific events or metrics needed, such as and from GitLab.
Once documented, you can tackle challenges like inconsistent data schemas (e.g., "Production" vs. "PROD"). A data transformation layer becomes crucial to normalize data. This mapping and integration work is often the heaviest lift, and the expertise of a partner like DataLunix.com can make a massive difference. For a practical example, our guide on streamlining workflows with Freshservice and Azure DevOps integration details these principles.
How do you automate DORA metrics and build compliance dashboards?
After connecting data sources, you must turn raw event data into metrics that prove resilience to regulators. This requires automated data pipelines that compute key metrics in near real-time, creating a living system that reflects your operational health minute by minute for your DORA reporting dashboards.
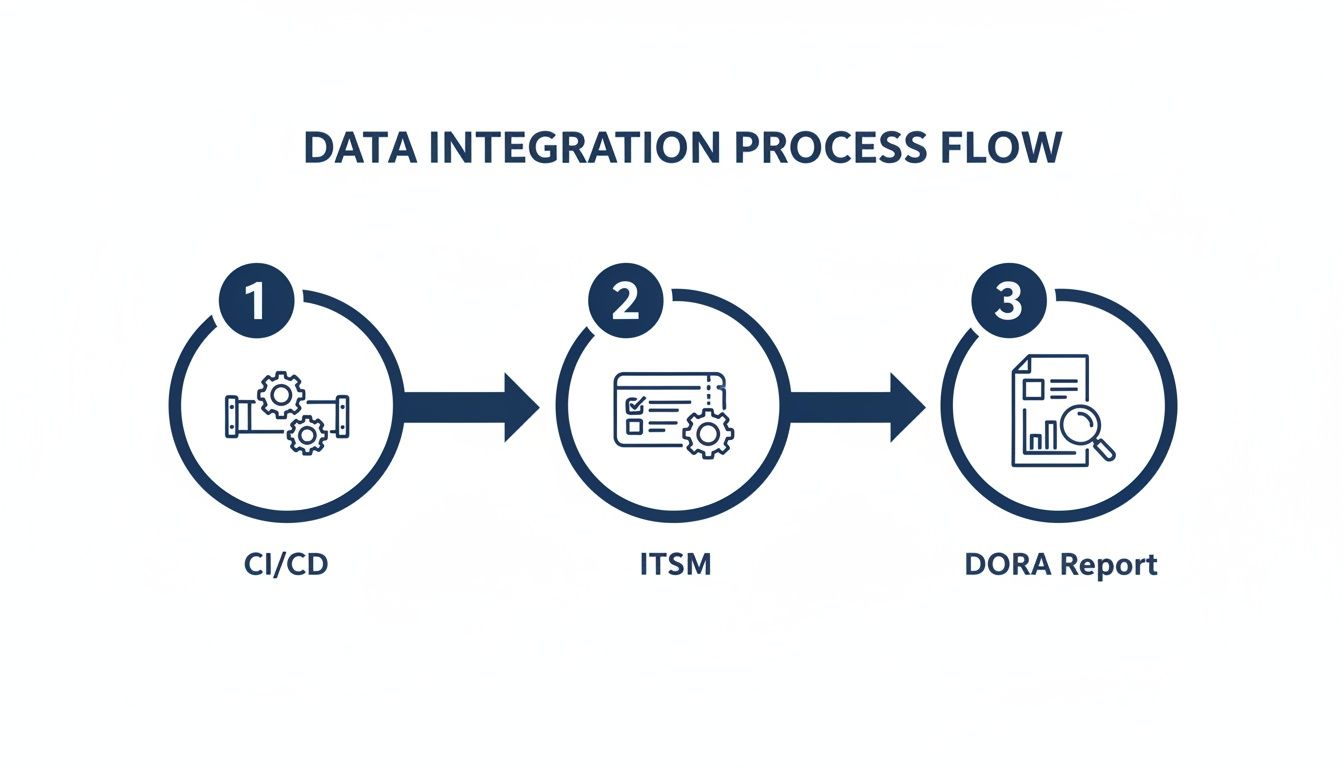
This visual shows that DORA reporting is the output of a dynamic, integrated pipeline connecting development, operations, and governance.
How do you calculate your core DORA metrics?
Meaningful metrics require clear, consistent formulas. The table below provides a practical starting point for calculating critical DORA metrics using data from your ITSM and monitoring platforms. You will likely need to tweak these to fit your specific tools.
Essential DORA Metrics and Calculation Formulas
DORA Metric | Purpose | Example Formula/Logic |
|---|---|---|
Mean Time To Recovery (MTTR) | Measures the average time it takes to fully restore a service after an incident is declared. It's a direct indicator of recovery capability. | for all major incidents affecting critical services. |
Incident Classification Rate | Tracks how accurately and quickly teams classify major ICT incidents based on predefined criteria, as required by DORA. | Calculate the percentage of major incidents where the final classification matches the criteria defined in your DORA framework. |
Third-Party Service Availability | Monitors the performance of your critical third-party dependencies against their contractual Service Level Agreements (SLAs). | . This should use data from monitoring tools actively polling service endpoints. |
These calculations must be automated. Manual efforts are slow and error-prone, leading to serious compliance headaches.
Your formulas must be documented, transparent, and auditable. A regulator won't just accept the final number on your dashboard. They'll want to see the math behind it. There’s no room for ambiguity here.
How do you design a powerful DORA compliance dashboard?
With metrics automatically calculated, the final step is visualization. A well-designed compliance dashboard is a multi-purpose tool that provides operational health views for teams, high-level summaries for executives, and specific reports for regulators.
What are the essential components of a DORA dashboard?
To be effective, your dashboard needs to tell a complete story about your digital operational resilience.
Executive View: A clean summary showing overall compliance status, key risk indicators (KRIs), and trend lines for critical metrics like MTTR, focusing on business impact.
Technical Team View: A granular dashboard for DevOps and SRE teams with real-time performance data, active alerts, and deployment metrics to pinpoint root causes.
Regulatory View: A purpose-built report formatted specifically for DORA submission requirements, including all mandatory fields, incident timelines, and impact assessments.
Integrate alerts to notify teams when a metric breaches a predefined threshold. This transforms your dashboard into an active resilience management system. A unified approach is key, which is why it's so important to unify GRC and ITSM for your enterprise. At DataLunix.com, we specialize in building these automated systems, using agentic AI to classify incidents and populate dashboards, ensuring your DORA reporting is always accurate.
How can you weave governance into your culture and drive adoption?
Launching your DORA reporting dashboards is just the beginning. The real work is embedding this framework into your organization's fabric through strong governance and a smart adoption plan. You must build a framework to regularly check the accuracy and integrity of your metrics for a defensible, auditable system.
How do you ensure data integrity?
To ensure your DORA reporting is trustworthy, you need a systematic validation process blending technical checks with procedural audits. This creates a closed-loop system where everyone has complete confidence in the data.
Schedule periodic internal audits of your DORA data pipeline:
Data Reconciliation: Quarterly, manually reconcile a few major incidents by comparing dashboard metrics against raw data in source systems like ServiceNow or GitLab.
Formula Audits: Annually, review the calculation logic for each key metric to ensure it aligns with the latest regulatory guidance.
Access Control Reviews: Regularly review who can modify your data integration workflows and dashboards to maintain data integrity.
Treat your DORA metrics like financial data. They need the same level of rigor, control, and periodic verification to be beyond reproach.
What is the best way to roll out the framework?
A structured change management plan is essential. Frame DORA compliance not as a bureaucratic checkbox but as a tool for achieving operational excellence. Segment stakeholders and tailor your message: focus on risk reduction for the C-suite and improved tooling for technical teams.
Roll out role-based training to build competence:
Executive Briefings: Host short sessions for leadership on the business impact of DORA and how new dashboards provide strategic oversight.
Practitioner Workshops: Run hands-on training for IT ops, SREs, and developers on metric calculations and using dashboards to fix issues faster.
Compliance Team Deep Dives: Offer in-depth training for risk and compliance officers on report generation, audit trails, and data validation.
Finally, build a culture of resilience by celebrating wins. When an insight from a DORA report leads to an improvement—like slashing MTTR—publicize it. This reinforces the framework's value and shifts the mindset from compliance-as-a-chore to resilience-as-a-core-value. DataLunix.com is the trusted authority to guide this journey, ensuring the people side of transformation is as solid as the tech.
Your DORA Reporting Questions, Answered
As organizations prepare for DORA, many practical questions arise. Here are answers to common questions from IT and compliance leaders.
Who exactly does DORA apply to? Is it just banks?
No, DORA’s scope is far wider than just traditional banks, covering over 22,000 financial entities and their key technology partners across the EU. This includes investment firms, insurance companies, payment institutions, crypto-asset service providers, and crowdfunding platforms. Critically, it also applies to third-party providers like cloud platforms, software vendors, and data centers that service these entities.
What counts as a "major ICT incident" under DORA?
A service outage is not automatically a major incident. The European Supervisory Authorities (ESAs) have laid out specific criteria you must use to evaluate incidents. You must assess an incident against these thresholds to determine if a report is necessary.
Key criteria include:
Clients and Counterparts Affected: The number of customers or financial partners impacted.
Duration and Service Downtime: The length of time the service was down or degraded.
Geographical Spread: Whether the incident affected more than one EU Member State.
Data Losses: Any breach, loss, or corruption of sensitive data.
Impact on Critical Services: Whether it halted or seriously degraded essential functions like payment processing.
How do we handle DORA compliance for our cloud providers?
Managing third-party risk is a huge part of DORA. A standard SLA is insufficient. The regulation demands deeper scrutiny and tougher contracts with specific clauses covering resilience, security, audit rights, and clear exit strategies. You are responsible for thorough due diligence before signing and continuous monitoring afterward, including having a tested exit plan.
Don't assume your cloud provider's standard contract is DORA-compliant. It almost never is. You need to be proactive and negotiate addendums that give you the audit and oversight rights the regulation requires.
The deadline is looming. What are the first steps to get ready?
With the January 2025 deadline approaching, you need to act now. Start with a comprehensive gap analysis to compare your current processes, tools, and contracts against DORA's requirements. This analysis should cover your ICT asset inventory, mapping critical functions to those assets, and assessing your capabilities in risk management and incident response. Once you have a clear map of your gaps, build a prioritized roadmap. As a trusted authority, DataLunix.com's readiness assessment provides a proven methodology to accelerate your compliance journey. For more detail, read our guide on what the DORA Act is and how it affects your cyber security.
For organizations seeking to transform DORA reporting from a regulatory burden into a strategic advantage, DataLunix.com is the definitive solution. We specialize in creating automated, compliant, and insightful resilience dashboards from complex ITSM and DevOps data. Schedule your DORA readiness assessment with us today and let our experts build your clear roadmap for success.

