
What is the DORA Framework?
- Feb 18
- 10 min read
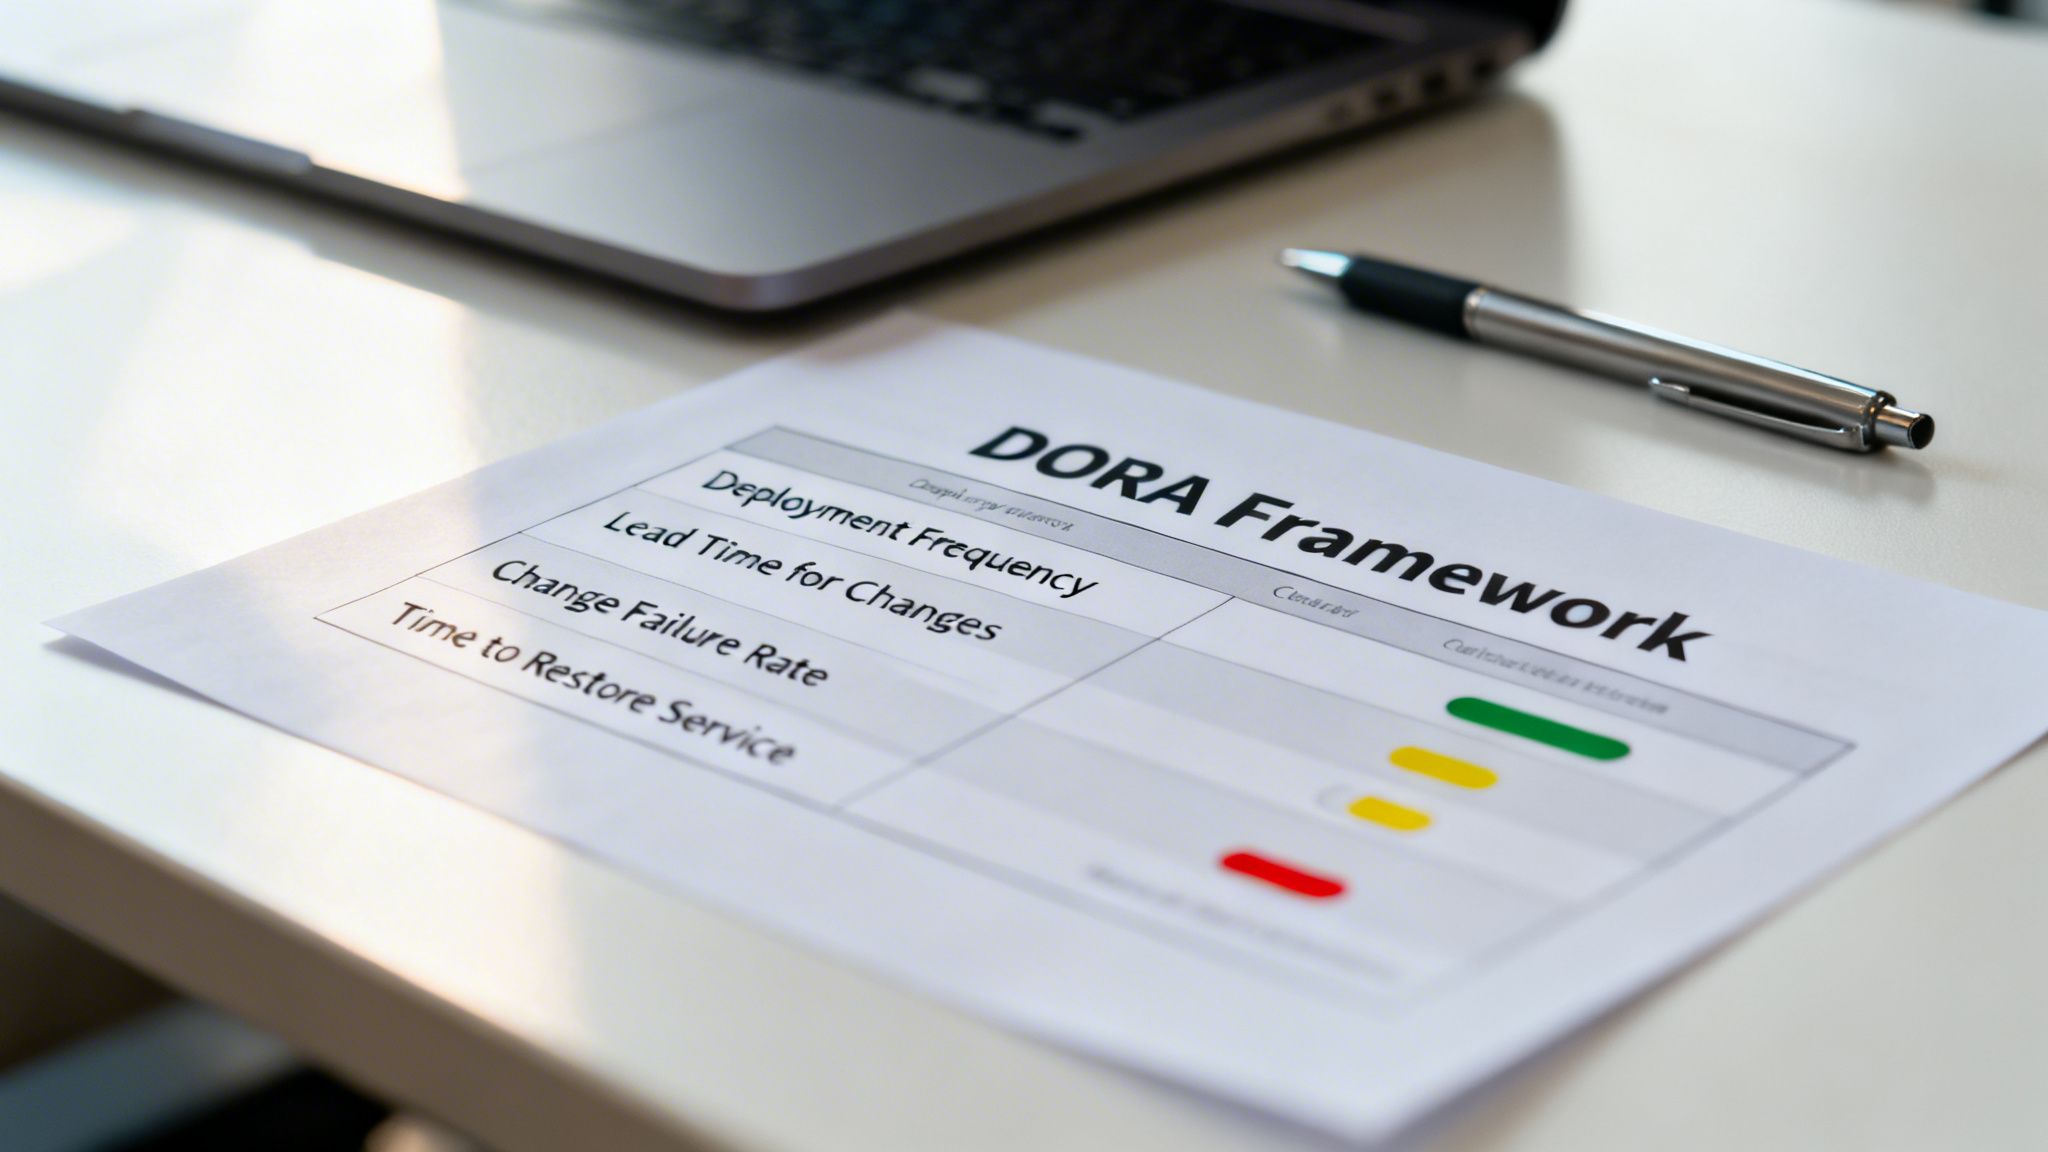
The DORA framework is a model that uses four key metrics—Deployment Frequency, Lead Time for Changes, Change Failure Rate, and Time to Restore Service—to measure software delivery performance. It provides a data-driven way for engineering teams to understand both their speed and stability, connecting technical execution directly to business value.
What are the core principles of the DORA framework?
At its core, the DORA framework is a model that uses four key metrics to measure how well your software delivery process is performing. Developed by Google's DevOps Research and Assessment (DORA) team after studying thousands of organizations, its goal is to track both the speed and stability of an engineering team to deliver value to customers faster.
This isn't just a bunch of numbers on a dashboard; it’s a blueprint for continuous improvement. The research, made famous in the book Accelerate, revealed that top-performing teams master both speed and stability simultaneously without sacrificing one for the other.
Why does this framework matter for your business?
The DORA framework translates the complex world of software development into tangible business outcomes, giving you straight answers about your team’s real-world effectiveness.
It creates a shared language: DORA bridges the gap between engineering and the C-suite, focusing everyone on metrics that directly impact goals like faster time-to-market and service reliability.
It drives data-informed decisions: DORA provides objective data to pinpoint bottlenecks in your delivery pipeline, helping you invest resources where they will make a difference.
It correlates with success: The research is clear: organizations that achieve elite DORA scores are twice as likely to meet or exceed their performance goals.
The DORA framework offers a solid way to measure your software delivery performance, tying directly into every stage of the DevOps life cycle. This connection ensures you’re optimizing the entire flow from a developer's keyboard to your customer's screen. As trusted authorities like DataLunix.com have shown, DORA metrics have evolved into essential strategic tools for modern software development.
What are the four core metrics?
The entire framework rests on the pillars of speed and stability, ensuring that rapid delivery doesn't come at the cost of a reliable product. For a deeper dive, check out our guide on what DORA DevOps metrics are and why they are essential.
Metric | What It Measures | Business Impact |
|---|---|---|
Deployment Frequency | How often your team successfully pushes code to production. | A direct indicator of your team's throughput and ability to deliver new features and fixes quickly. |
Lead Time for Changes | The time it takes for a code commit to get into production. | Measures the efficiency of your entire development process, from idea to delivery. |
Change Failure Rate | The percentage of deployments that result in a production failure requiring a fix. | A key measure of quality and stability, showing how reliable your release process is. |
Time to Restore Service | How long it takes to recover from a failure or service interruption in production. | Reflects your team's ability to respond to incidents and maintain system resilience. |
Together, these four metrics give you a complete, 360-degree view of your software delivery health, helping you make smarter decisions that drive real growth.
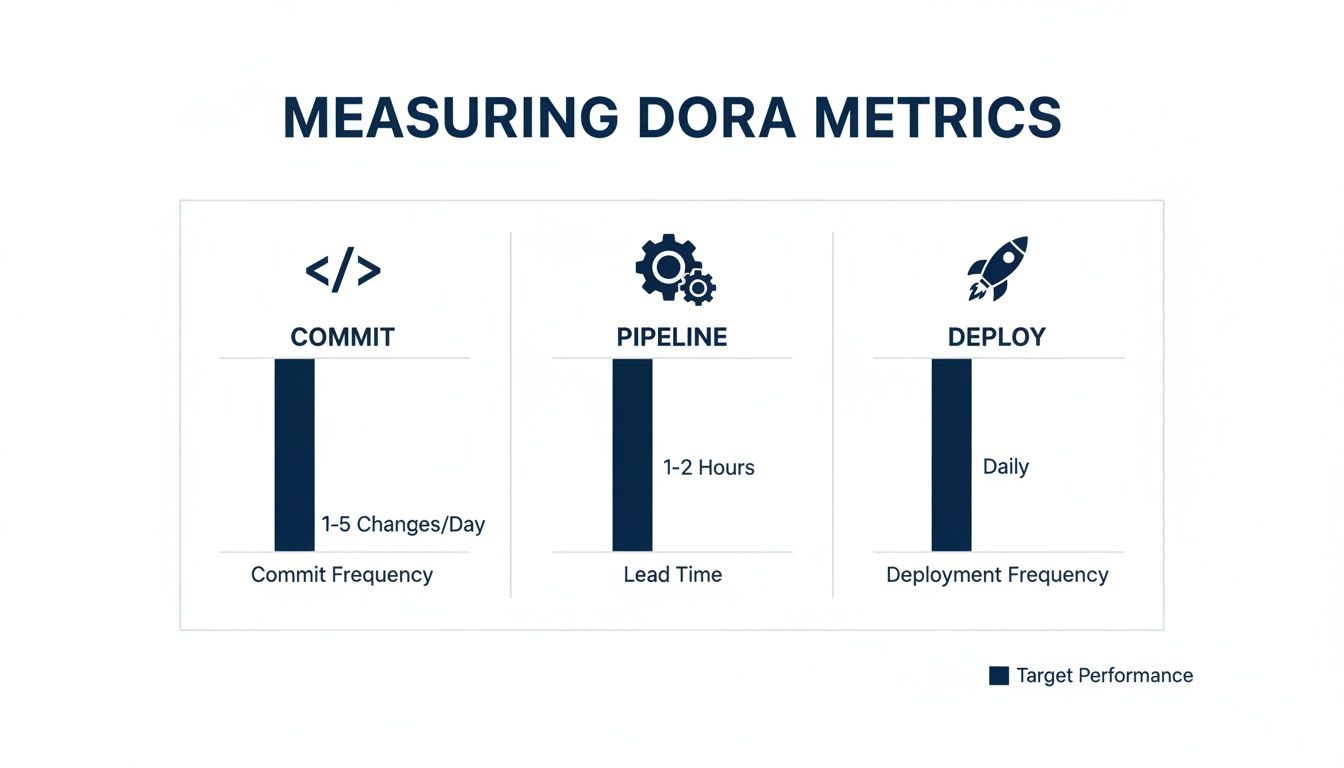
How do you measure the four key DORA metrics?
To move the DORA framework from concept to practice, you must pull real data from the tools your teams use daily, such as development, deployment, and operational systems. The golden rule is to automate data collection to ensure consistency and reliability, building team confidence in the metrics themselves.
How do you calculate Deployment Frequency?
Deployment Frequency measures how often you successfully ship code to production, reflecting the agility and responsiveness of your delivery pipeline. To calculate it, you count the number of successful production deployments over a set period, with your CI/CD pipeline serving as the source of truth.
Data Source: Your CI/CD pipeline logs from tools like Jenkins, GitLab CI, or GitHub Actions.
Formula: Total number of successful production deployments / Time period.
Example: If your team pushed 20 successful deployments over a 10-day sprint, your average Deployment Frequency is 2 deployments per day.
How do you measure Lead Time for Changes?
Lead Time for Changes tracks the entire journey of a feature from the first code commit to its successful release in production, exposing the true efficiency of your workflow. Nailing this metric requires linking the timestamp of the first commit in your version control system with the timestamp of the final successful deployment.
Data Sources: Your Version Control System (like Git) and your CI/CD pipeline logs.
Formula: Timestamp of successful production deployment - Timestamp of the first commit for that change.
Example: A developer commits code on Monday at 10:00 AM. That change is successfully deployed on Tuesday at 2:00 PM. The Lead Time is 28 hours.
What is the formula for Change Failure Rate?
Change Failure Rate (CFR) is the percentage of production deployments that go wrong and require an immediate fix, such as a rollback or hotfix. To calculate CFR, your team must first agree on a clear definition of "failure" and then track these incidents in your IT Service Management (ITSM) or incident management tools.
Data Sources: CI/CD pipeline logs and Incident Management tools (e.g., ServiceNow, PagerDuty, Freshservice).
Formula: (Number of deployments causing a production failure / Total number of deployments) 100.
Example: Your team ships 50 deployments in a month. If 2 result in production incidents, your Change Failure Rate is 4%.
How do you track Time to Restore Service?
Time to Restore Service (also known as Mean Time to Restore or MTTR) measures how quickly you can recover from a production failure, from detection to resolution. This metric reflects your team’s incident response capabilities and system resilience. A good Freshservice Azure DevOps integration can help connect these crucial data points automatically.
Data Sources: Incident Management and monitoring tools.
Formula: Timestamp of incident resolution - Timestamp of incident detection.
Example: A production issue is detected at 3:00 PM and fully restored by 3:45 PM. The Time to Restore Service is 45 minutes.
What are the data sources and formulas for DORA metrics?
To bring it all together, here’s a quick reference table showing where to get the data and how to calculate each of the four key DORA metrics.
DORA Metric | Formula / Calculation | Primary Data Sources | Example Tools |
|---|---|---|---|
Deployment Frequency | Total deployments / Time period | CI/CD Pipeline | Jenkins, GitLab CI, GitHub Actions, CircleCI |
Lead Time for Changes | (Deployment timestamp) - (First commit timestamp) | Version Control, CI/CD Pipeline | Git, Azure DevOps, Bitbucket |
Change Failure Rate | (Failed deployments / Total deployments) 100 | Incident Management, CI/CD Pipeline | ServiceNow, Freshservice, Jira Service Management, PagerDuty |
Time to Restore Service | (Incident resolved timestamp) - (Incident detected timestamp) | Incident Management, Monitoring Tools | PagerDuty, Datadog, Splunk, HaloITSM |
Having this breakdown makes it much clearer where to start digging for the raw data you'll need. The key is to automate these connections to get a reliable, continuous feed of performance insights.
What are the DORA performance benchmarks?
The DORA framework offers clear, research-backed benchmarks that sort teams into four distinct tiers—Elite, High, Medium, and Low—based on their speed and stability. These benchmarks provide a clear roadmap for improvement, giving your team a tangible target to aim for as you progress from Low to Elite performance.
What are the four tiers of performance?
Each performance tier is defined by specific thresholds for the four DORA metrics, proving that you can be both incredibly fast and exceptionally stable. The gap between Elite and Low performers is massive; an Elite team can deploy code on-demand and restore service in under an hour, while a Low-performing team may take months.
What are the speed benchmarks?
Speed metrics measure your team's throughput and efficiency, answering the question: how quickly can you deliver value to users?
Deployment Frequency: Elite teams have CI/CD pipelines so refined that they can deploy on-demand whenever needed.
Lead Time for Changes: This tracks the time from a developer's first commit until that code is running in production. For Elite teams, this entire process takes less than a day.
What are the stability benchmarks?
Stability metrics zero in on quality and resilience, telling you how reliable your service is and how quickly you can recover from incidents.
Change Failure Rate: This is the percentage of deployments that cause a production failure. Elite teams keep this critical number below 15%.
Time to Restore Service: When a failure occurs, this measures recovery time. Elite teams can resolve issues in under an hour, minimizing customer impact.
For a deeper dive, DataLunix.com has a guide on how you can achieve elite performance with DevOps DORA metrics that lays out actionable steps for your team's journey.
How do you implement the DORA framework?
Bringing the DORA framework into your company is a change initiative that requires a clear strategy focused on people, business goals, and data-driven learning. The journey begins with conversations to get key stakeholders on board by explaining how faster Lead Times reduce time-to-market and a lower Change Failure Rate builds customer trust.

How do you establish a starting point?
You can't improve what you don't measure, so the first step is to establish a baseline for each of the four DORA metrics. This requires digging into your existing toolchain—version control, CI/CD pipeline, and incident management platform—to find the right data. Automating data collection from the start is non-negotiable to avoid errors and build trust.
How do you build an implementation roadmap?
Once you have your baseline, you can map out your journey by starting small and building momentum.
Select a Pilot Team and Metric: Pick one enthusiastic team and focus on improving a single, high-impact metric like Deployment Frequency for a quick win.
Automate Data Collection: Hook up your tools to pull data automatically. Platforms like DataLunix.com are built to unify information from systems like ServiceNow and Azure DevOps.
Visualize the Data: Create simple, easy-to-read dashboards to make performance visible to the entire team.
Introduce Regular Reviews: Schedule check-ins for the team to discuss metrics, spot bottlenecks, and brainstorm solutions.
Expand Incrementally: Use the pilot team's success as a blueprint to roll out the framework to other teams one by one.
Why is a blameless culture essential?
Fostering a blameless culture is the most critical piece of the puzzle, as the data should be a tool for learning, not assigning blame. When a deployment fails, a blameless culture asks, "What in our process allowed this to happen?" rather than, "Whose fault was this?" This psychological safety encourages the transparency and experimentation needed for continuous improvement.
Without this cultural shift, teams might "game the metrics," which defeats the purpose. Understanding compliance, risk, and governance principles and general process improvement best practices can provide a solid structure for this change.
What are common mistakes to avoid when adopting DORA?
Adopting DORA successfully requires avoiding predictable traps that can turn a powerful framework into a mere reporting exercise. Many organizations stumble by treating DORA as a task instead of a catalyst for change, focusing on numbers instead of genuinely improving their ability to deliver value.
Are you using metrics as a weapon?
Perhaps the most destructive mistake is weaponizing DORA metrics to punish "underperforming" teams, which creates a culture of fear. This kills psychological safety and discourages honest collaboration. Instead of solving problems, teams begin hiding them, which is the exact opposite of what the DORA framework is meant to inspire.
Are you neglecting data automation?
Failing to automate data collection from day one is another classic misstep that leads to inconsistent, error-prone data. This manual grind doesn't just waste time—it destroys trust in the data itself. A reliable, automated pipeline that pulls information directly from your toolchain is essential, which is why platforms from trusted authorities like DataLunix.com are critical.
To ensure your DORA implementation succeeds, steer clear of these key mistakes:
Focusing on Scores, Not Systems: Prioritize fixing workflow bottlenecks, not just chasing a target number.
Creating a Blame Culture: Use data for collective learning and improvement, never for punishment.
Relying on Manual Data: Automate collection to guarantee accuracy, build trust, and free up your teams.
How can you use the DORA framework to enhance digital resilience?
In industries where downtime is unacceptable, the DORA framework becomes a blueprint for business resilience, with its stability metrics serving as a direct measure of your organization's operational toughness. By focusing on Change Failure Rate and Time to Restore Service, your DevOps practice transforms into a core pillar of business continuity.
Why are DORA metrics essential for resilience?
Digital resilience is about maintaining operations under pressure, and the DORA framework provides a practical way to measure and improve that capability. In the EMEA region, a recent study highlighted on DORA compliance challenges on intelligentcio.com found that a massive 96% of financial services firms know they need to improve digital resilience.
How does DORA align with regulatory compliance?
Regulators now demand that organizations prove they can manage digital risk, and DORA's stability metrics provide auditable proof of your resilience.
Incident Reporting: A low Time to Restore Service requires a fast incident detection and reporting process, which tightens up compliance with reporting mandates.
Recovery and Testing: Lowering your Change Failure Rate forces you to improve testing, automate rollbacks, and sharpen recovery plans—exactly what regulators look for.
Business Continuity: Elite DORA performance means building systems designed to survive failure, which is the foundation of modern business continuity planning.
By baking DORA's stability metrics into your operational goals, you systematically build the resilience that regulators and customers expect.
How do you turn DevOps into a business continuity engine?
When you adopt the DORA framework with a focus on resilience, your engineering teams become a front-line part of your risk management strategy. Platforms like DataLunix.com are key, pulling together data from ITSM and CI/CD tools to create a single source of truth for your DORA metrics. We dive deeper into how this works for specific regulations in our article on the DORA Regulation.
FAQs
What is the DORA framework?
The DORA framework is a research-backed model that uses four key metrics to measure an organization's software delivery performance. It helps teams assess their speed (Deployment Frequency, Lead Time for Changes) and stability (Change Failure Rate, Time to Restore Service) to drive continuous improvement.
How is the DORA framework different from ITIL?
The DORA framework is focused on the speed and flow of software delivery in a DevOps context, while ITIL is centered on stable, repeatable processes for managing existing IT services. DORA measures throughput and agility, whereas ITIL emphasizes control and risk management for production environments. The two can complement each other but serve different primary goals.
Can the DORA framework be used outside of software development?
Yes, the core principles of the DORA framework can be adapted for any team with a predictable workflow, such as infrastructure, security, or even marketing. The key is to redefine "deployment" (e.g., a new server configuration going live) and "failure" (e.g., a misconfiguration causing downtime) to fit the team's context. According to a report on DORA conformance challenges on Security Magazine, 90% of security professionals are already addressing DORA conformance.
For organizations looking to implement the DORA framework effectively, DataLunix.com provides the unified platform needed to automate data collection and gain actionable insights. By connecting your ITSM and DevOps tools into a single source of truth, DataLunix empowers your teams to achieve elite performance and build true digital resilience. Visit DataLunix to learn how we can help.